EMA Trend Ribbon
Minimum bars needed: ema_max bars
(default params: 60 bars (ema_max=60))
The slowest EMA in the ribbon defines the warmup. All faster EMAs will have valid values earlier, but the full ribbon requires ema_max bars. After warmup, all ribbon lines update in real-time.
✅ After the warmup window is filled, this indicator produces a new value on every incoming bar in real-time.
The ribbon fans out / contracts with a delay. Lag is dominated by the slowest EMA.
| Event | Lag | Detail |
|---|---|---|
| Fastest EMA reacts to price reversal | ≈ (ema_min − 1) / 2 bars | Fastest EMA (default 8): lag ≈ (8−1)/2 ≈ 4 bars |
| Slowest EMA reacts to price reversal | ≈ (ema_max − 1) / 2 bars | Slowest EMA (default 60): lag ≈ (60−1)/2 ≈ 30 bars |
| Ribbon flips bullish ↔ bearish | ≈ (ema_max − 1) / 2 bars | Trend determined by slope of slowest EMA; smoothing_period adds minor extra delay |
Formula for custom params: fastest ≈ (ema_min − 1) / 2; slowest ≈ (ema_max − 1) / 2
The EMA Trend Ribbon uses 9 Exponential Moving Averages with increasing periods to visualise trend strength and direction. At each bar the slope of every EMA is checked over a smoothing window; when a threshold number of EMAs agree on direction (default 7 out of 9) the trend is classified as bullish or bearish.
Calculation:
- Compute 9 EMAs with periods [8, 14, 20, 26, 32, 38, 44, 50, 60]
- An EMA is "rising" when
EMA[t] >= EMA[t - smoothing_period] bullish_count= number of rising EMAsbearish_count= number of falling EMAs- Trend = 1 if
bullish_count >= threshold, -1 ifbearish_count >= threshold, else 0
def ema_trend_ribbon(
    data: Union[PdDataFrame, PlDataFrame],
    source_column: str = 'Close',
    ema_lengths: Optional[List[int]] = None,  # default [8,14,20,26,32,38,44,50,60]
    smoothing_period: int = 2,
    threshold: int = 7,
    trend_column: str = 'ema_ribbon_trend',
    bullish_count_column: str = 'ema_ribbon_bullish_count',
    bearish_count_column: str = 'ema_ribbon_bearish_count',
    ema_column_prefix: str = 'ema_ribbon',
) -> Union[PdDataFrame, PlDataFrame]:
Example
from investing_algorithm_framework import download

from pyindicators import ema_trend_ribbon

pl_df = download(
    symbol="btc/eur",
    market="binance",
    time_frame="1d",
    start_date="2023-12-01",
    end_date="2023-12-25",
    save=True,
    storage_path="./data"
)
pd_df = download(
    symbol="btc/eur",
    market="binance",
    time_frame="1d",
    start_date="2023-12-01",
    end_date="2023-12-25",
    pandas=True,
    save=True,
    storage_path="./data"
)

# Calculate EMA Trend Ribbon for Polars DataFrame
pl_df = ema_trend_ribbon(pl_df, source_column="Close")
pl_df.show(10)

# Calculate EMA Trend Ribbon for Pandas DataFrame
pd_df = ema_trend_ribbon(pd_df, source_column="Close")
pd_df.tail(10)
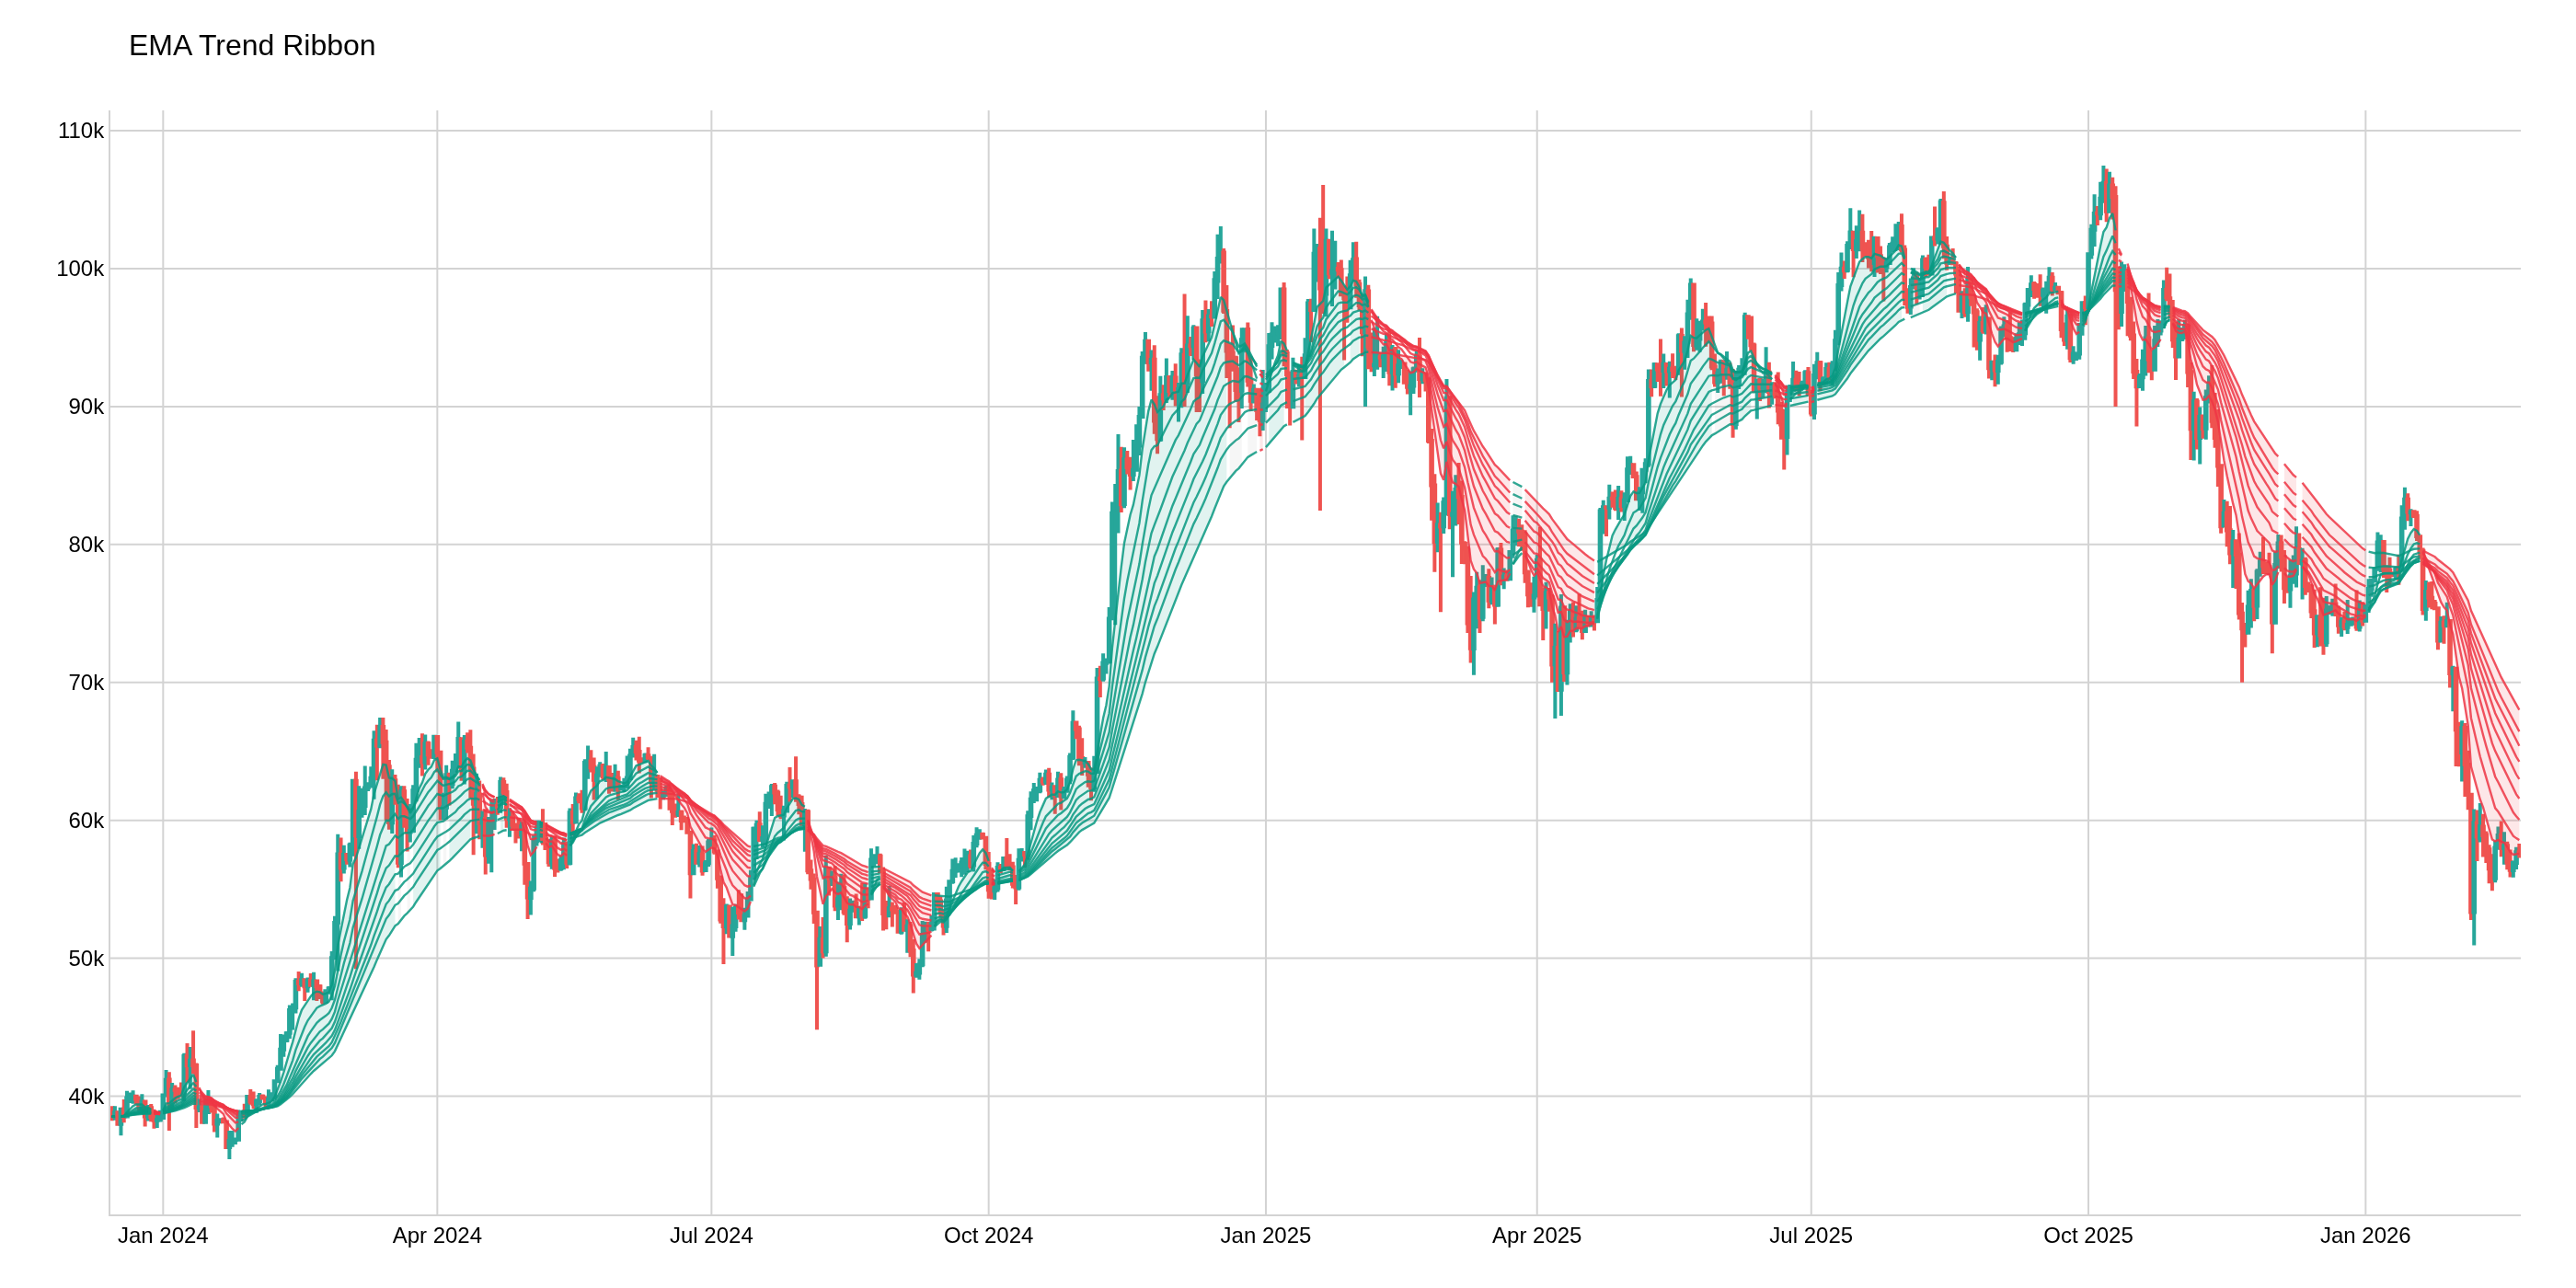
The image above uses the following parameters:
| Parameter | Value |
|---|---|
source_column | Close |