Volatility Indicators
Volatility indicators measure how much price is moving, regardless of direction. They help you size positions, set stop-losses, and identify when markets are unusually quiet (potential breakout) or loud (potential exhaustion). All volatility indicators are lagging because they smooth historical price ranges.
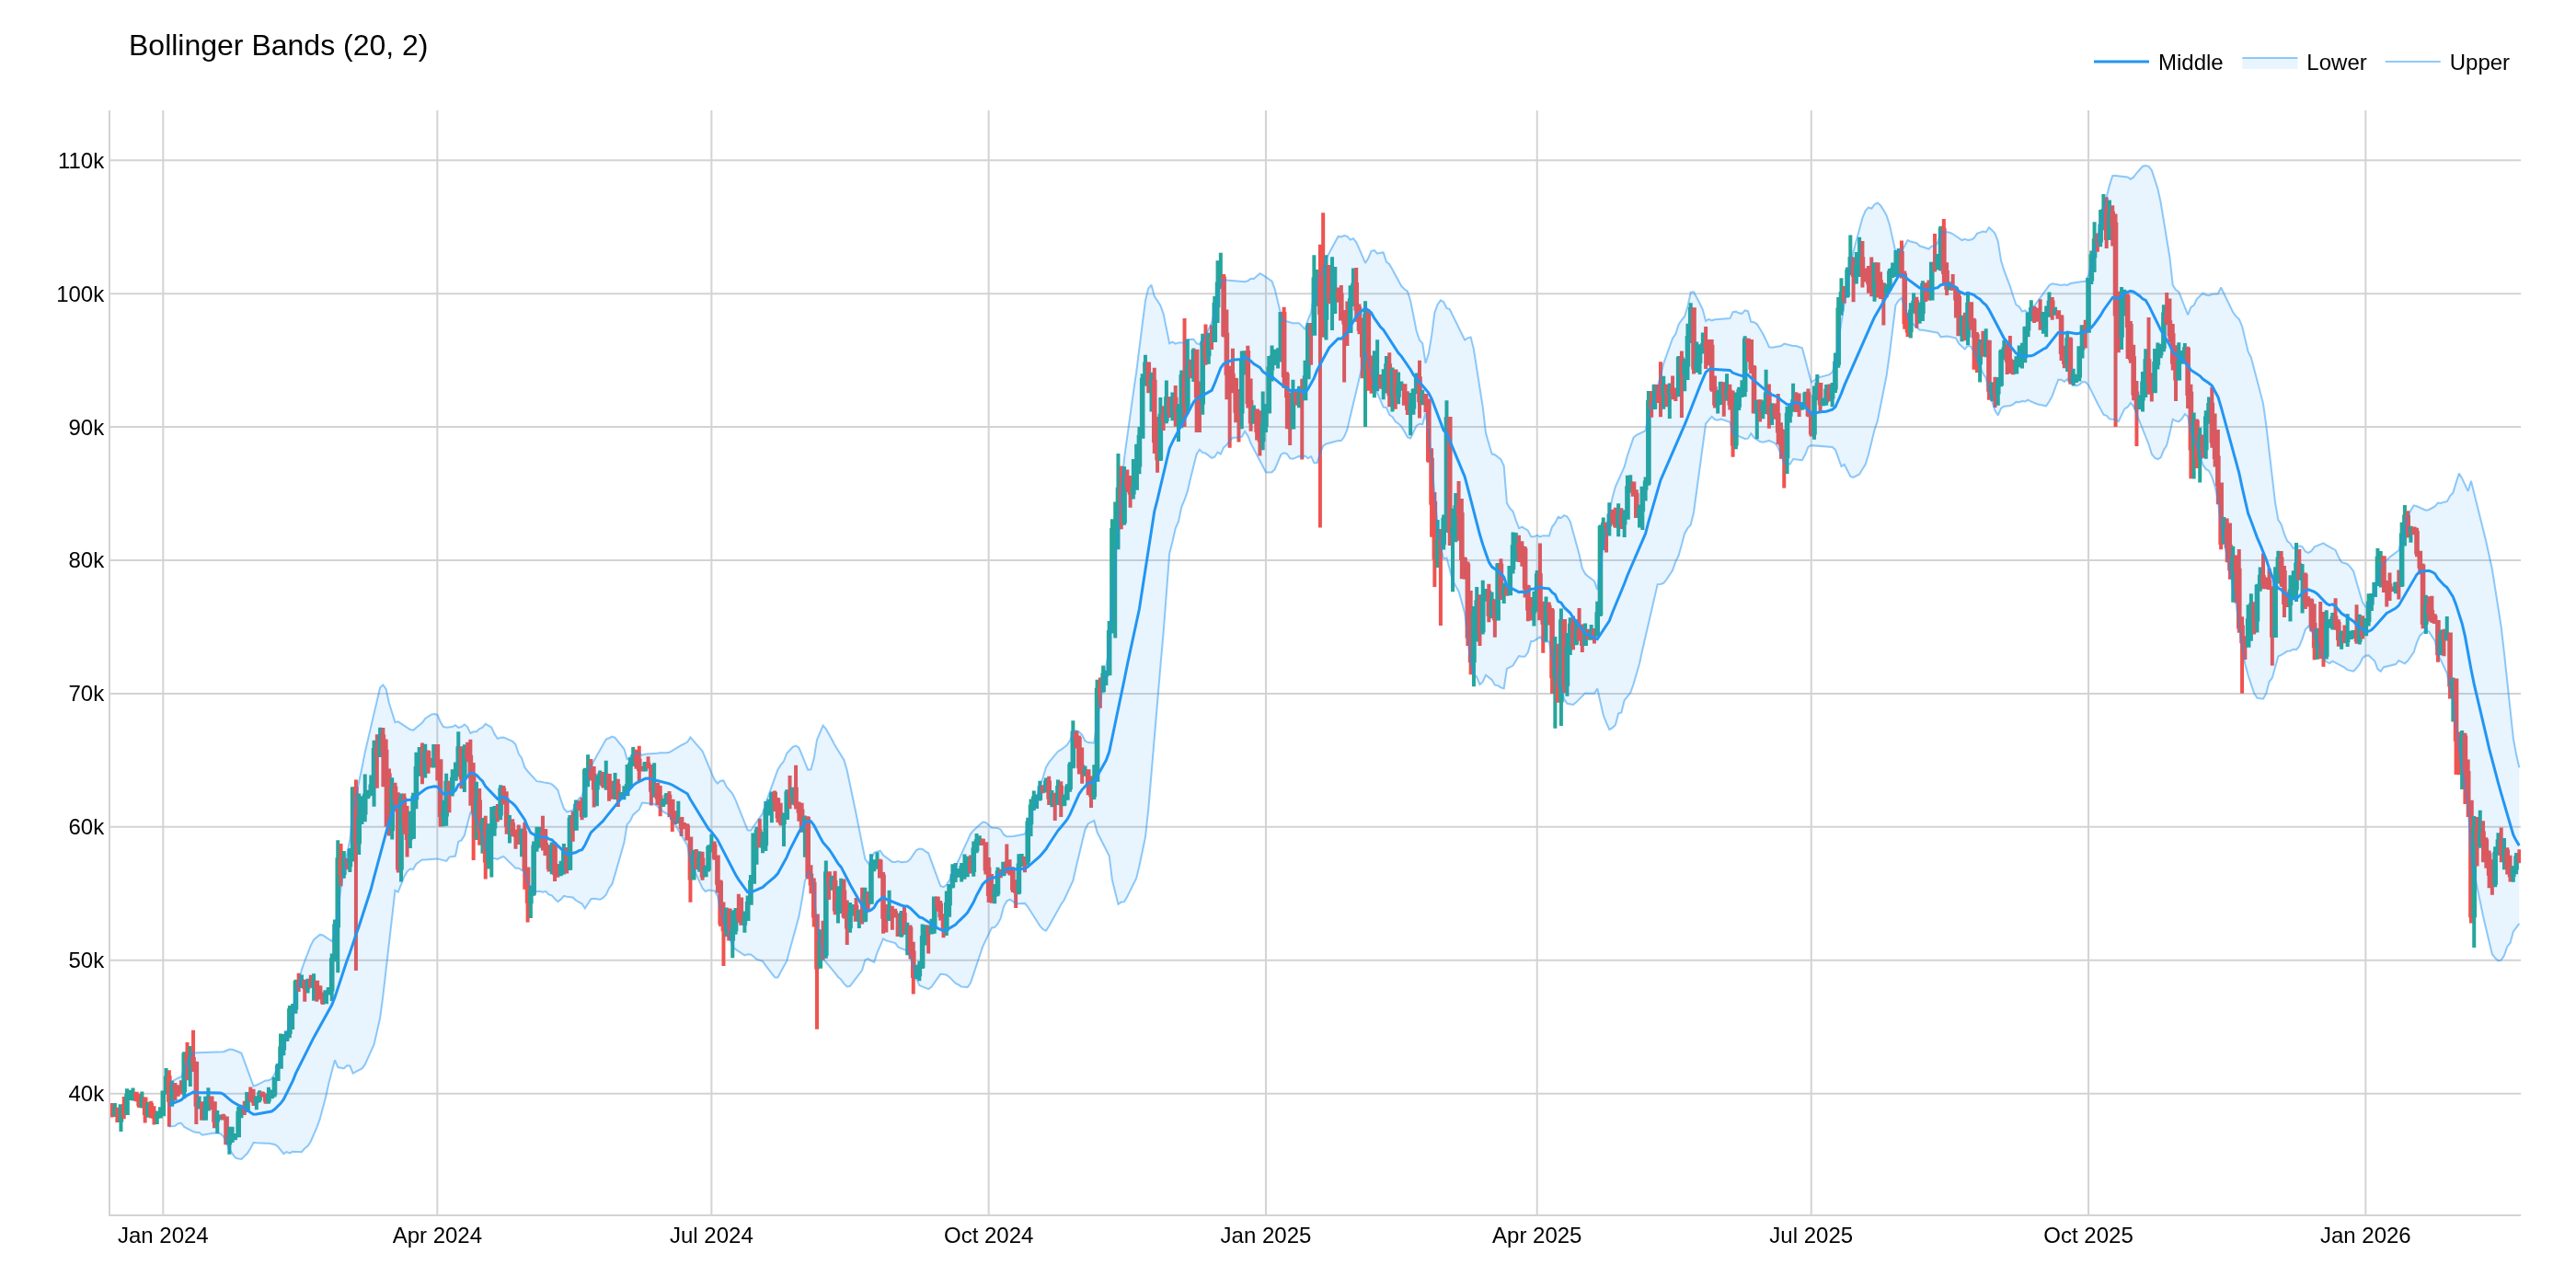
Bollinger Bands (BB)
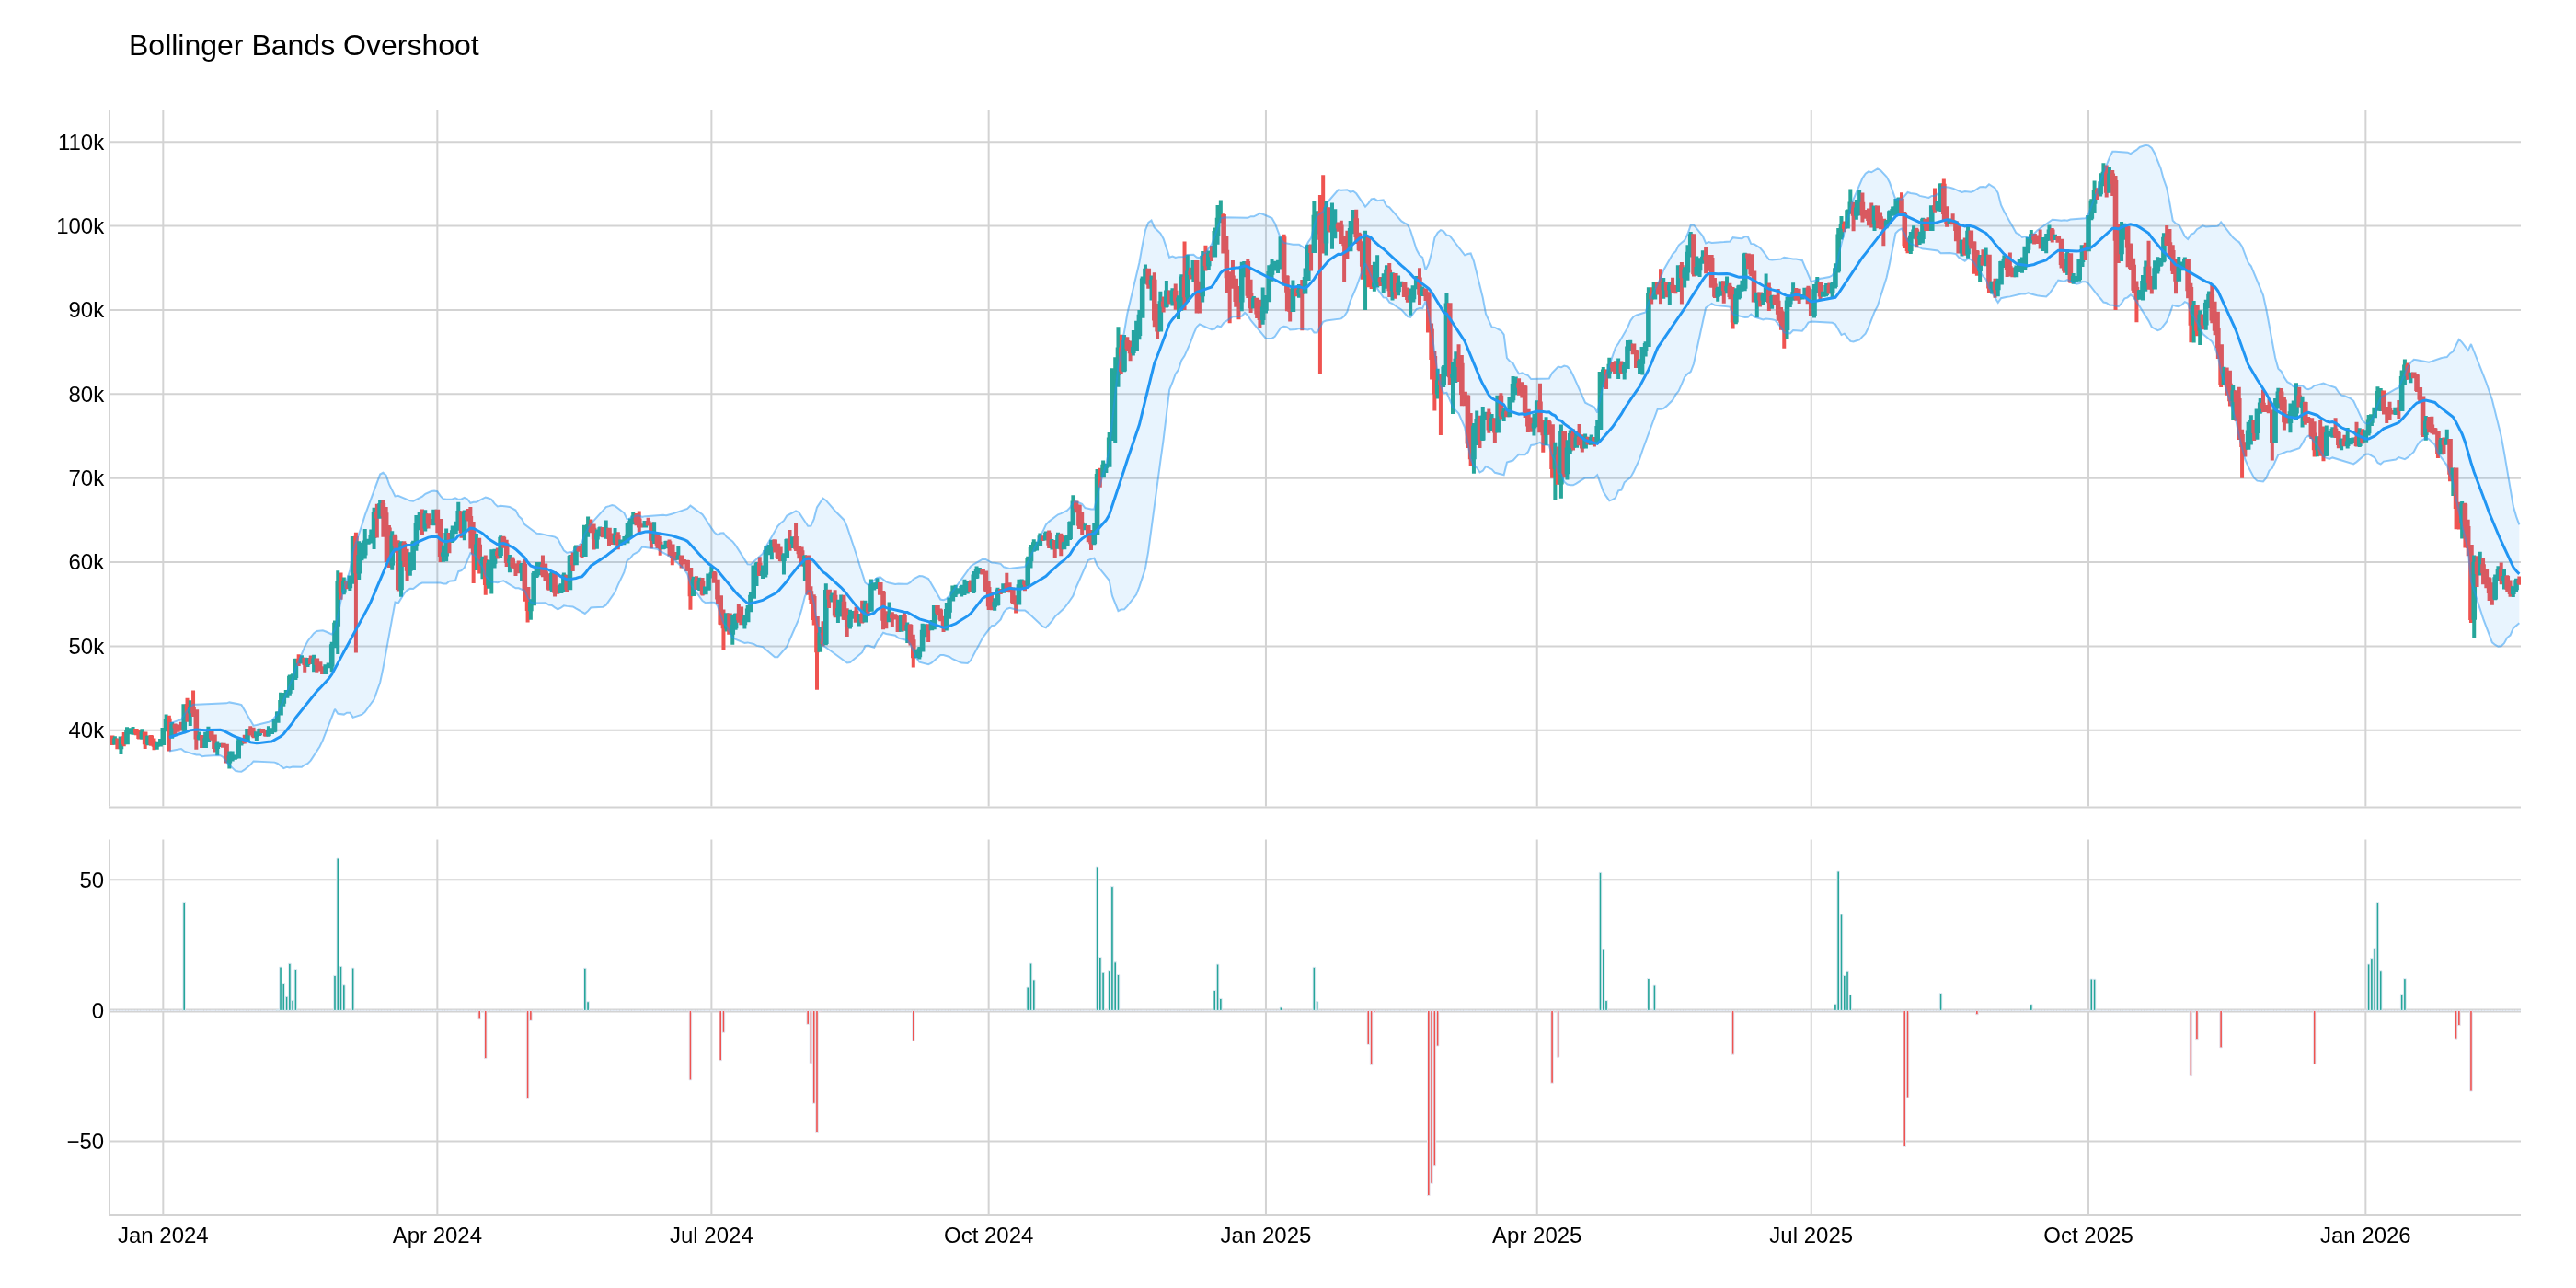
Bollinger Bands Overshoot
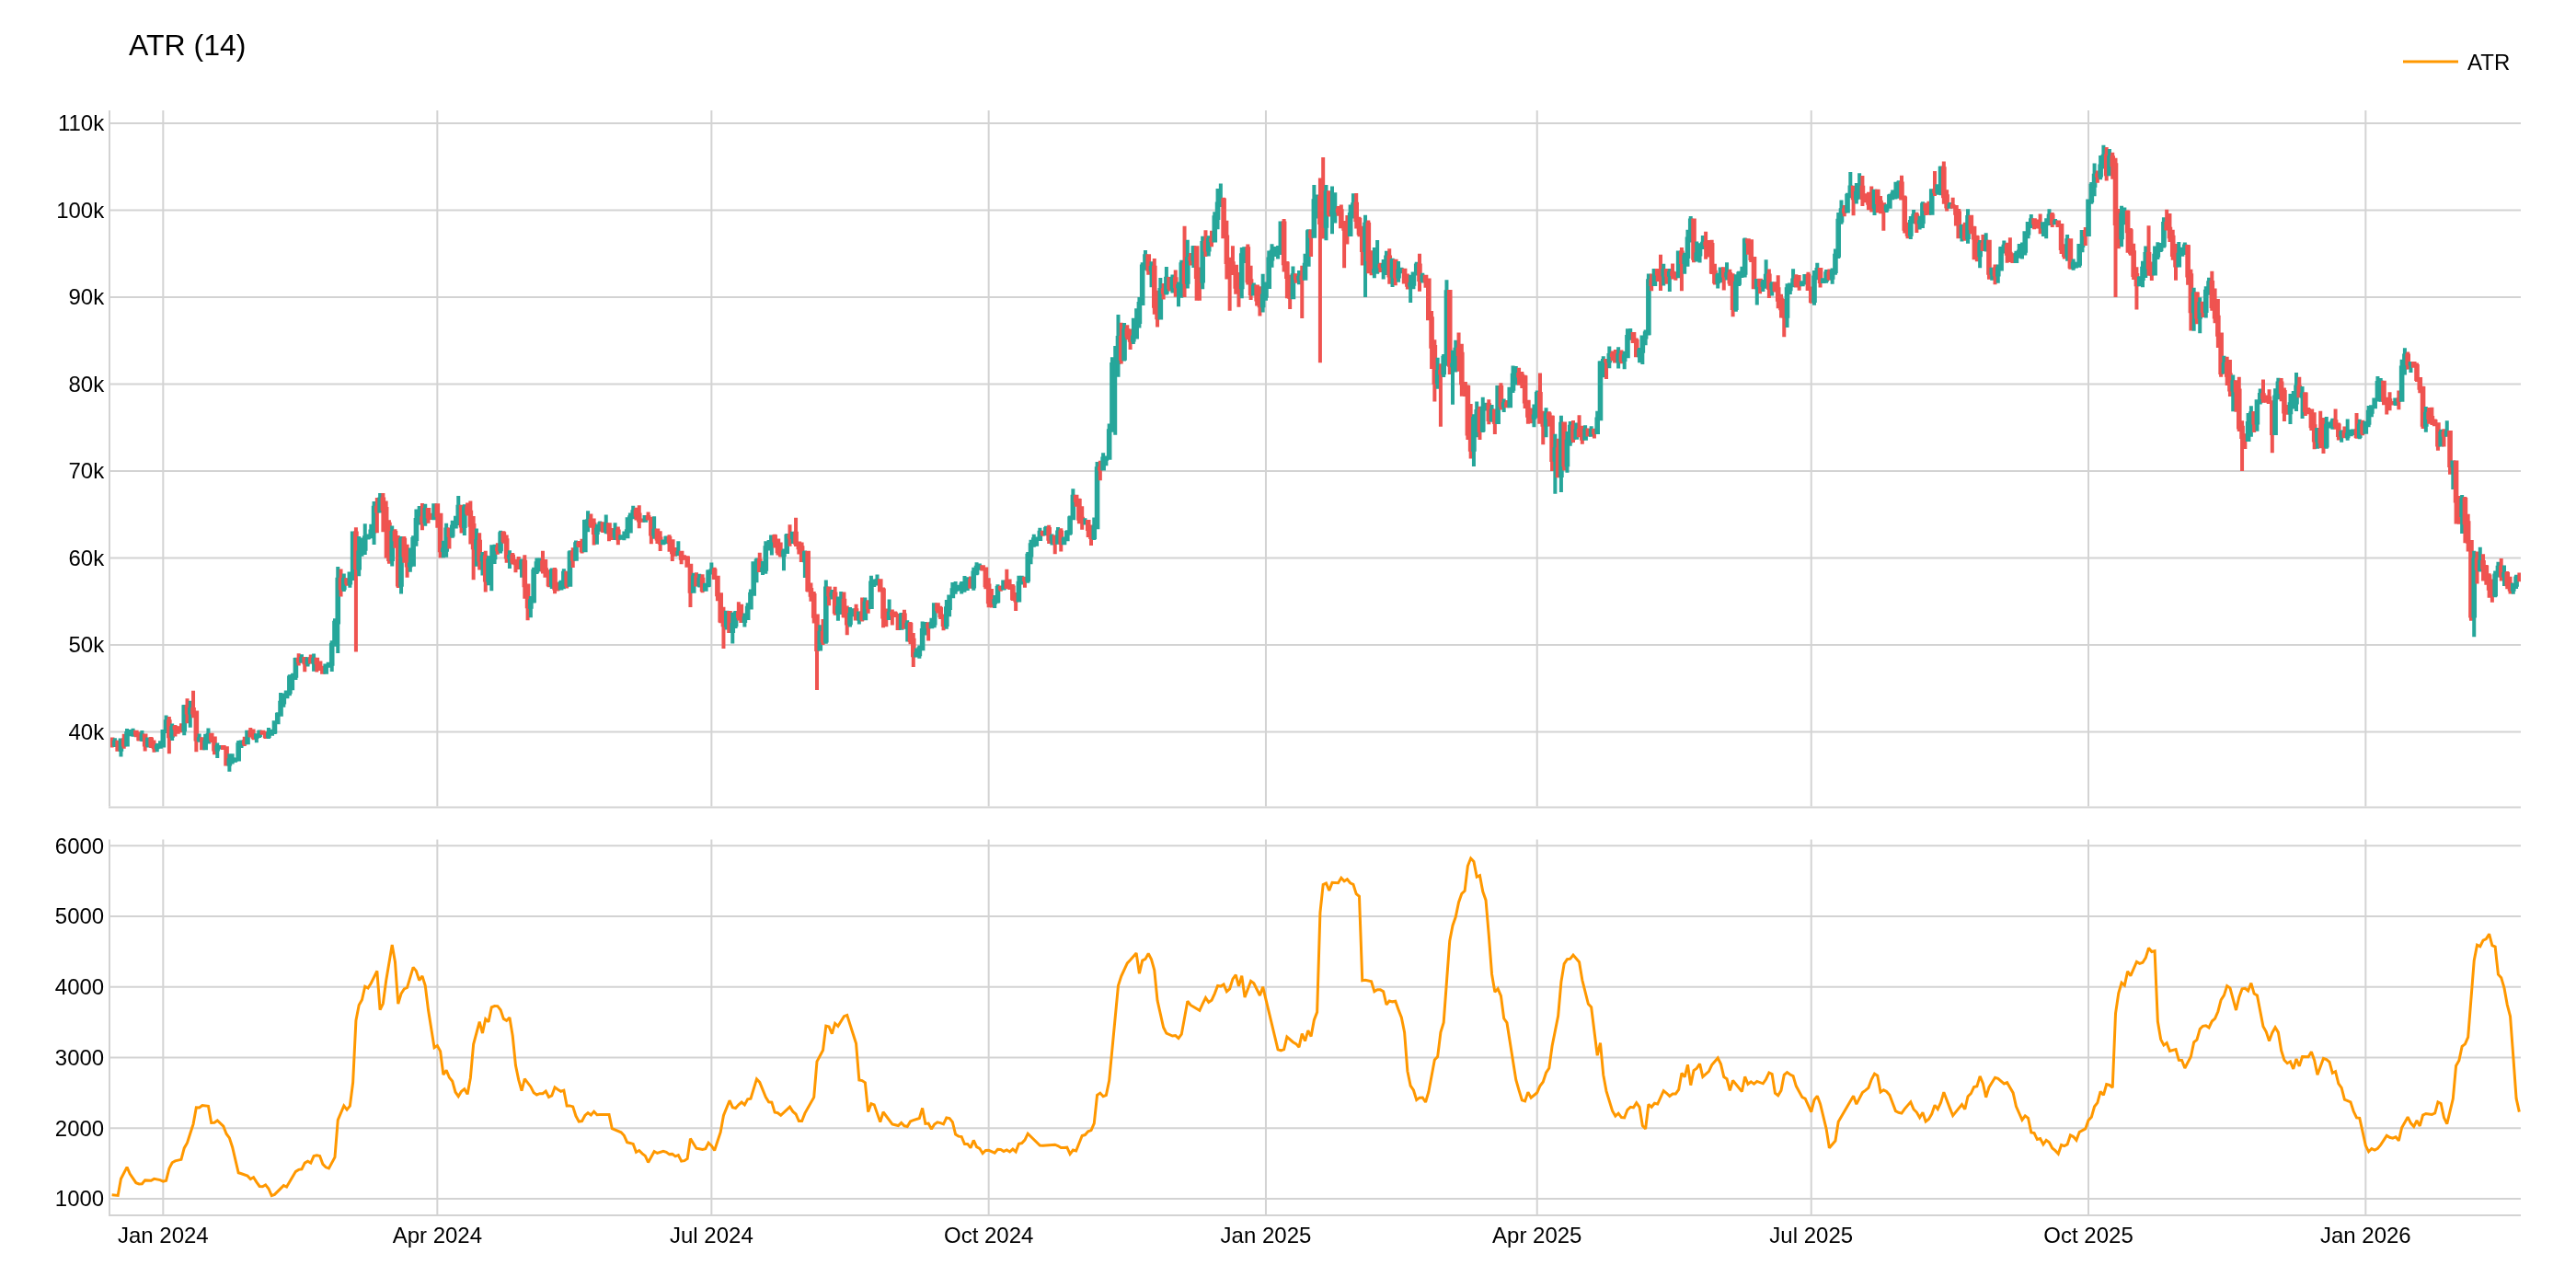
Average True Range (ATR)
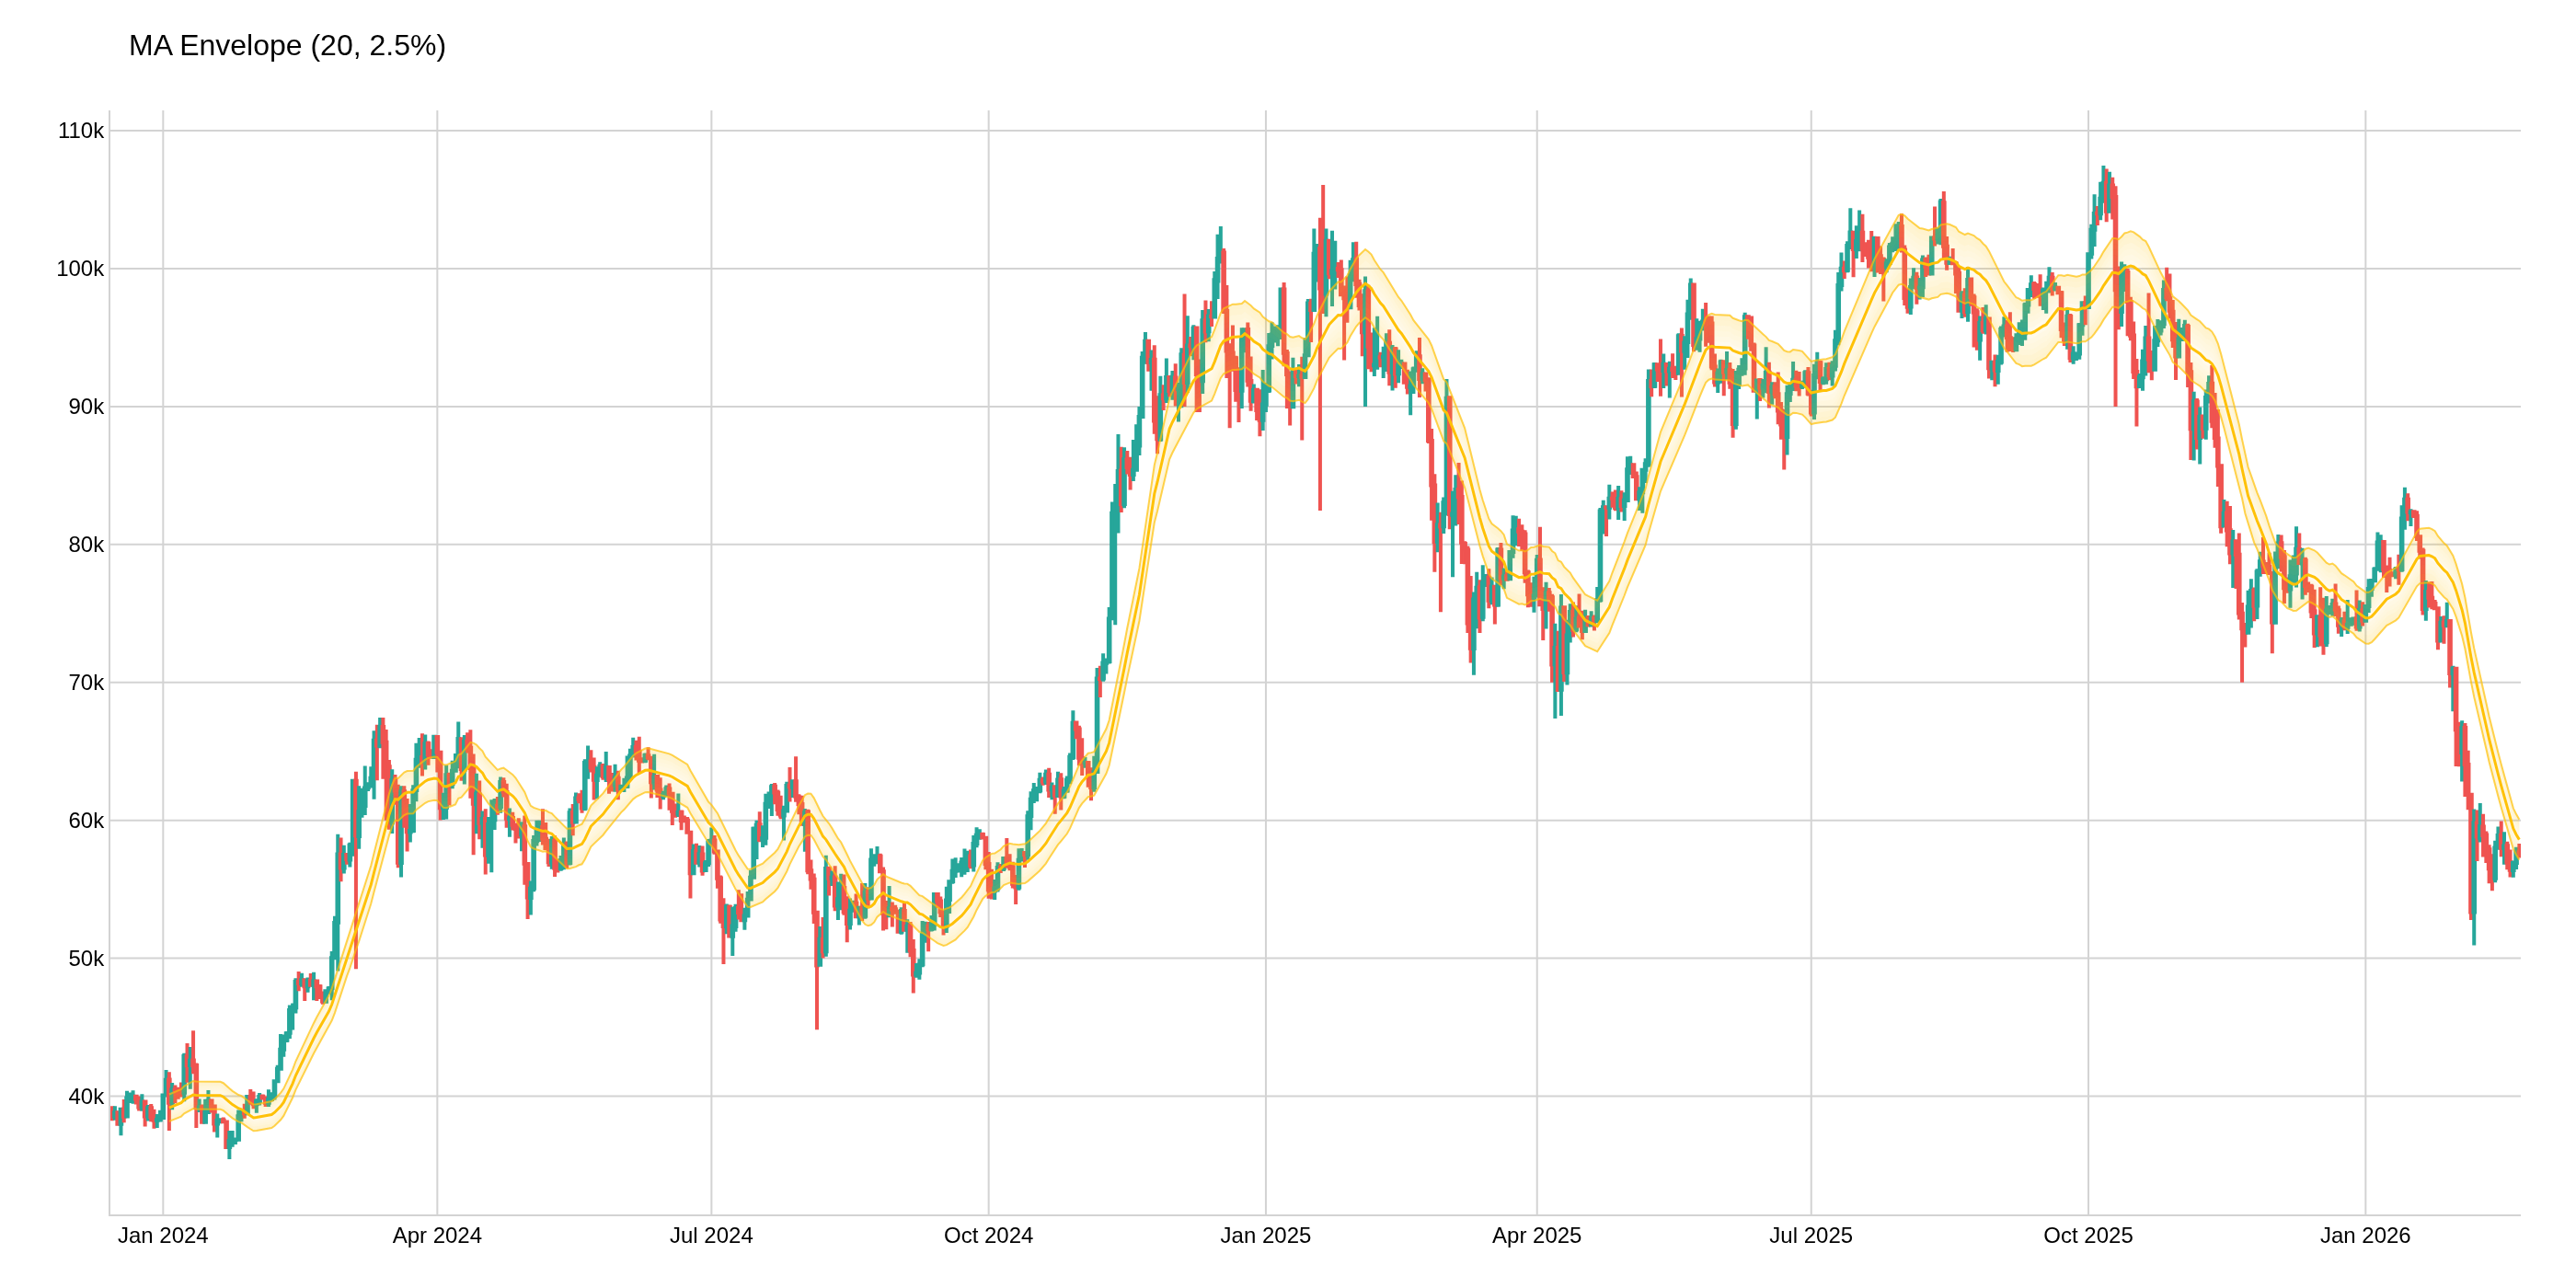
Moving Average Envelope (MAE)
Nadaraya-Watson Envelope (NWE)
Indicators at a glance
| Indicator | Type | Warmup | Lag | When to use |
|---|---|---|---|---|
| Bollinger Bands (BB) | 🔴 Lagging | period bars | ≈ period / 2 bars | The standard volatility envelope. Bands widen in volatile markets and contract in quiet ones. Use them for mean-reversion entries (price touching outer band), breakout detection (squeeze), and dynamic support/resistance. |
| Bollinger Bands Overshoot | 🔴 Lagging | period bars | ≈ period / 2 bars | Measures how far price extends beyond the Bollinger Bands. Use it to quantify overshoot extremes and identify high-probability mean-reversion setups. |
| Average True Range (ATR) | 🔴 Lagging | period bars | ≈ period / 2 bars | The go-to measure of absolute volatility. Use ATR for position sizing (risk per trade), trailing stop distances, and as a building block for other indicators like SuperTrend. |
| Moving Average Envelope (MAE) | 🔴 Lagging | period bars | ≈ period / 2 bars | Fixed-percentage bands around a moving average. Simpler than Bollinger Bands — use it when you want consistent band width for mean-reversion or breakout signals. |
| Nadaraya-Watson Envelope (NWE) | 🔴 Lagging | lookback bars | bandwidth-dependent | A non-parametric kernel-regression envelope that adapts to the shape of price data. Use it when standard MA-based envelopes don't capture complex price curves well. |
Detailed descriptions
Bollinger Bands (BB)
🔴 Lagging — ≈
period / 2barsWarmup:
periodbars (default: 20 bars (period=20))
The standard volatility envelope. Bands widen in volatile markets and contract in quiet ones. Use them for mean-reversion entries (price touching outer band), breakout detection (squeeze), and dynamic support/resistance.
Bollinger Bands Overshoot
🔴 Lagging — ≈
period / 2barsWarmup:
periodbars (default: 20 bars (period=20))
Measures how far price extends beyond the Bollinger Bands. Use it to quantify overshoot extremes and identify high-probability mean-reversion setups.
Average True Range (ATR)
🔴 Lagging — ≈
period / 2barsWarmup:
periodbars (default: 14 bars (period=14))
The go-to measure of absolute volatility. Use ATR for position sizing (risk per trade), trailing stop distances, and as a building block for other indicators like SuperTrend.
Moving Average Envelope (MAE)
🔴 Lagging — ≈
period / 2barsWarmup:
periodbars (default: 20 bars (period=20))
Fixed-percentage bands around a moving average. Simpler than Bollinger Bands — use it when you want consistent band width for mean-reversion or breakout signals.
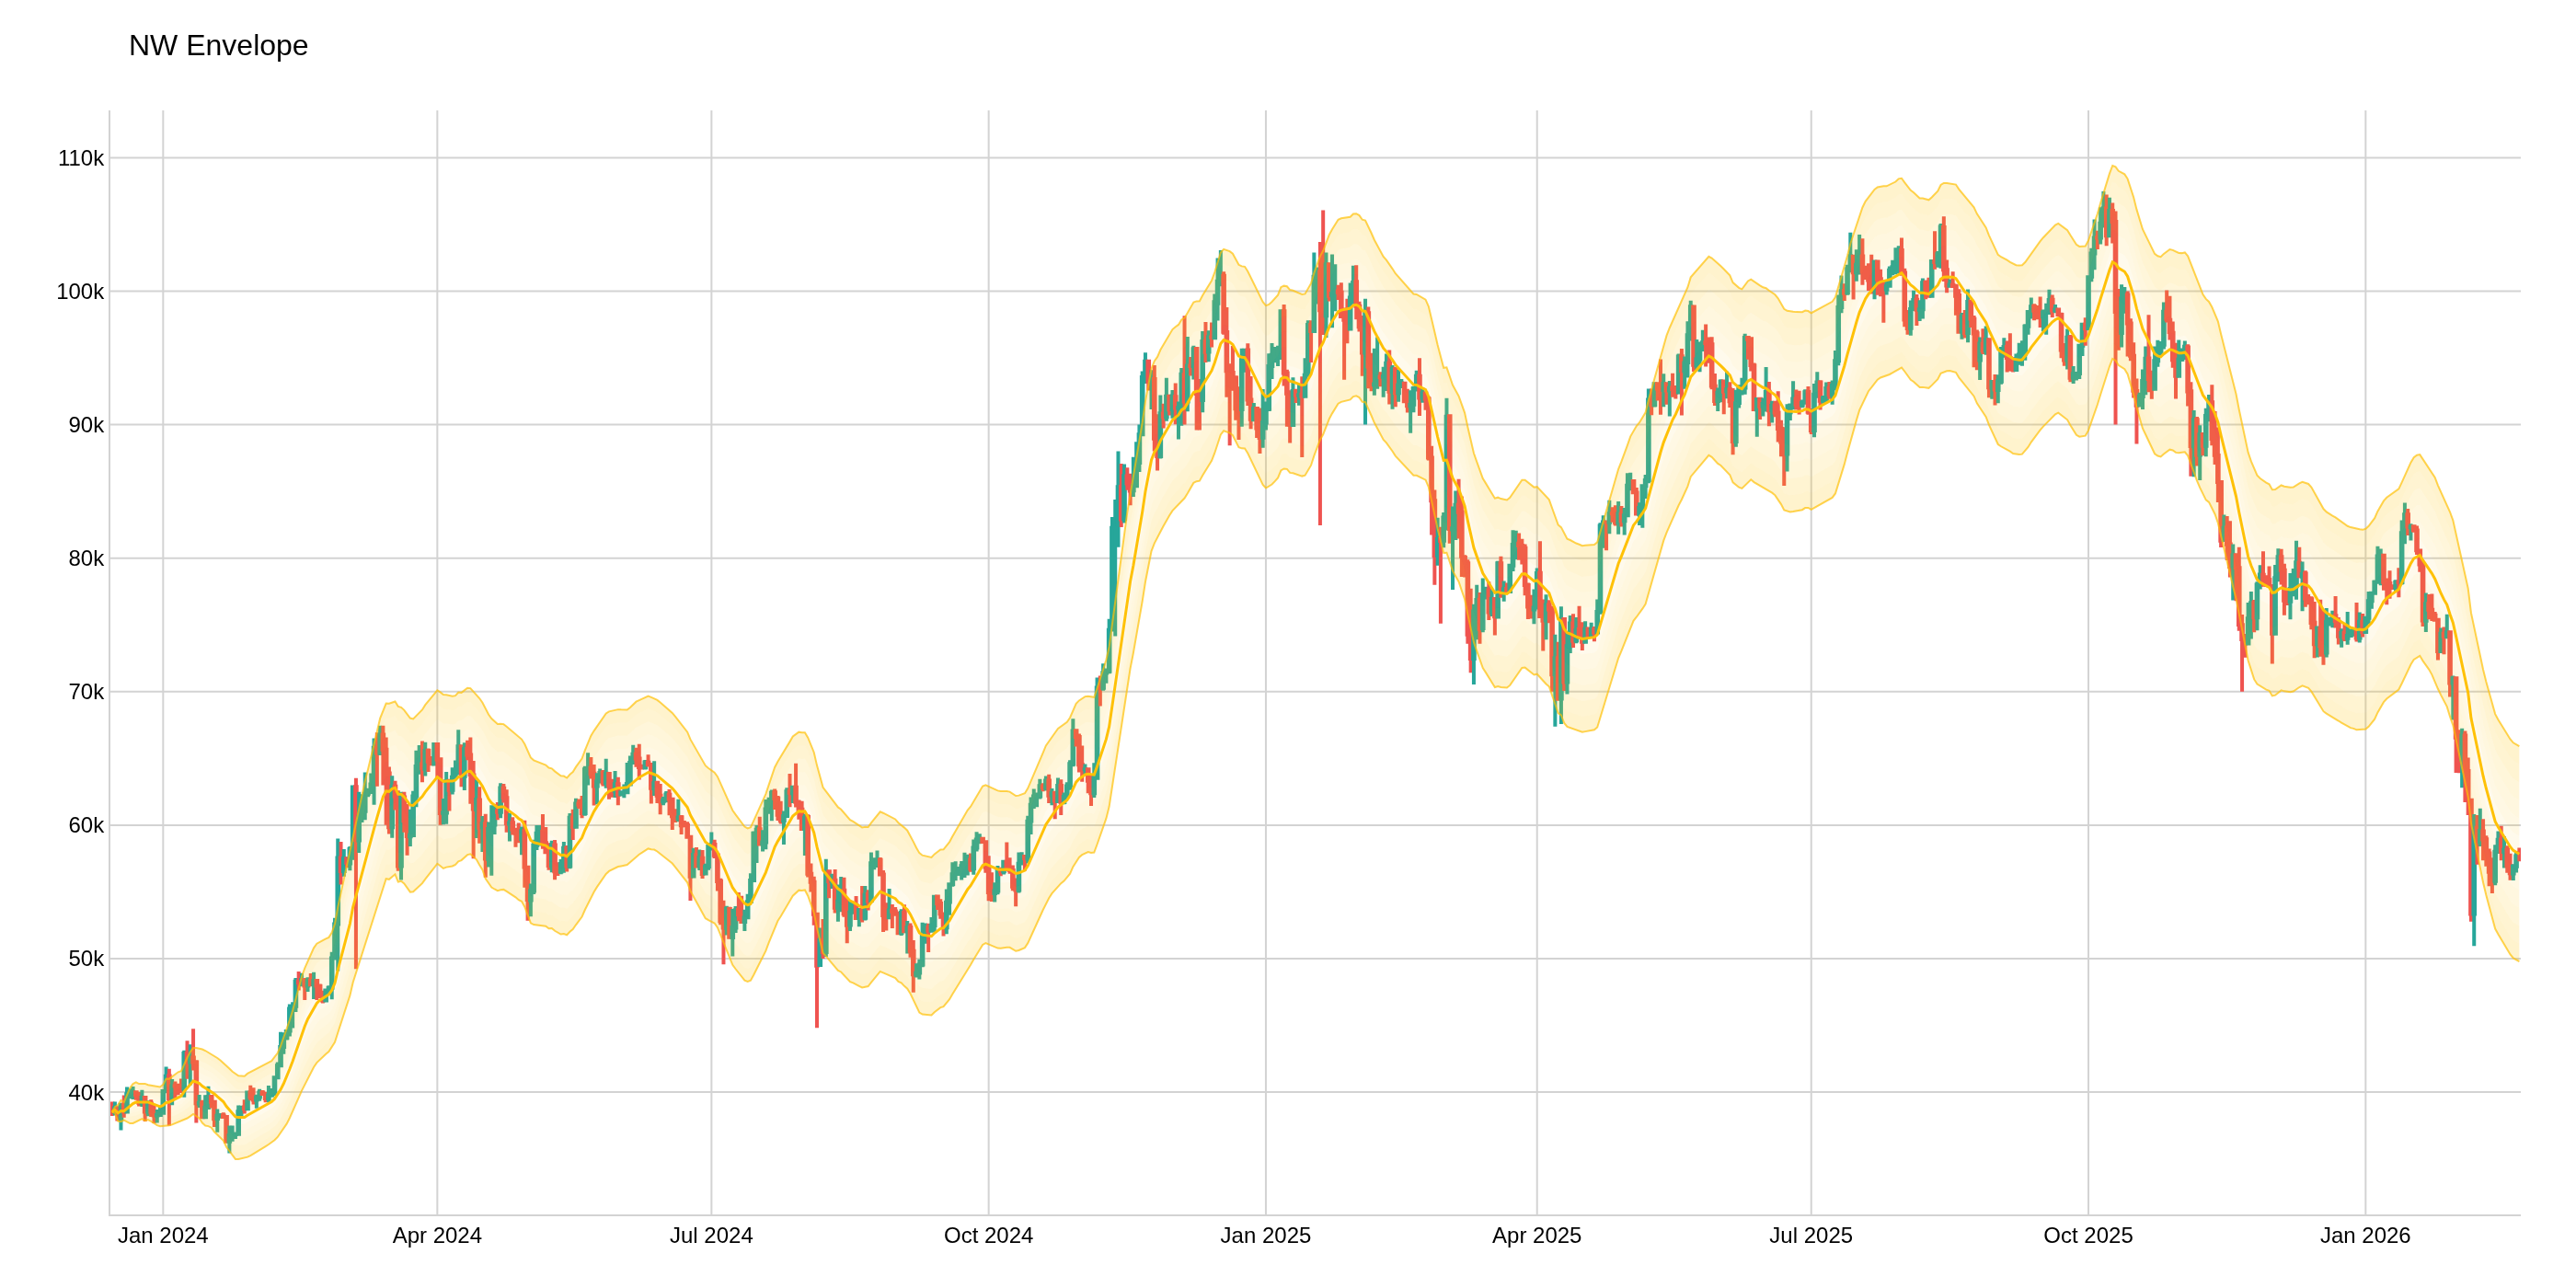
Nadaraya-Watson Envelope (NWE)
🔴 Lagging — bandwidth-dependent
Warmup:
lookbackbars (default: 500 bars (lookback=500))
A non-parametric kernel-regression envelope that adapts to the shape of price data. Use it when standard MA-based envelopes don't capture complex price curves well.