Momentum & Oscillators
Momentum indicators measure the speed and strength of price movements. They oscillate between extremes and are particularly useful for identifying overbought/oversold conditions, momentum divergence, and trend exhaustion. All momentum indicators are lagging due to their smoothing calculations, but they excel at confirming the quality of a trend and signaling when it may be losing steam.
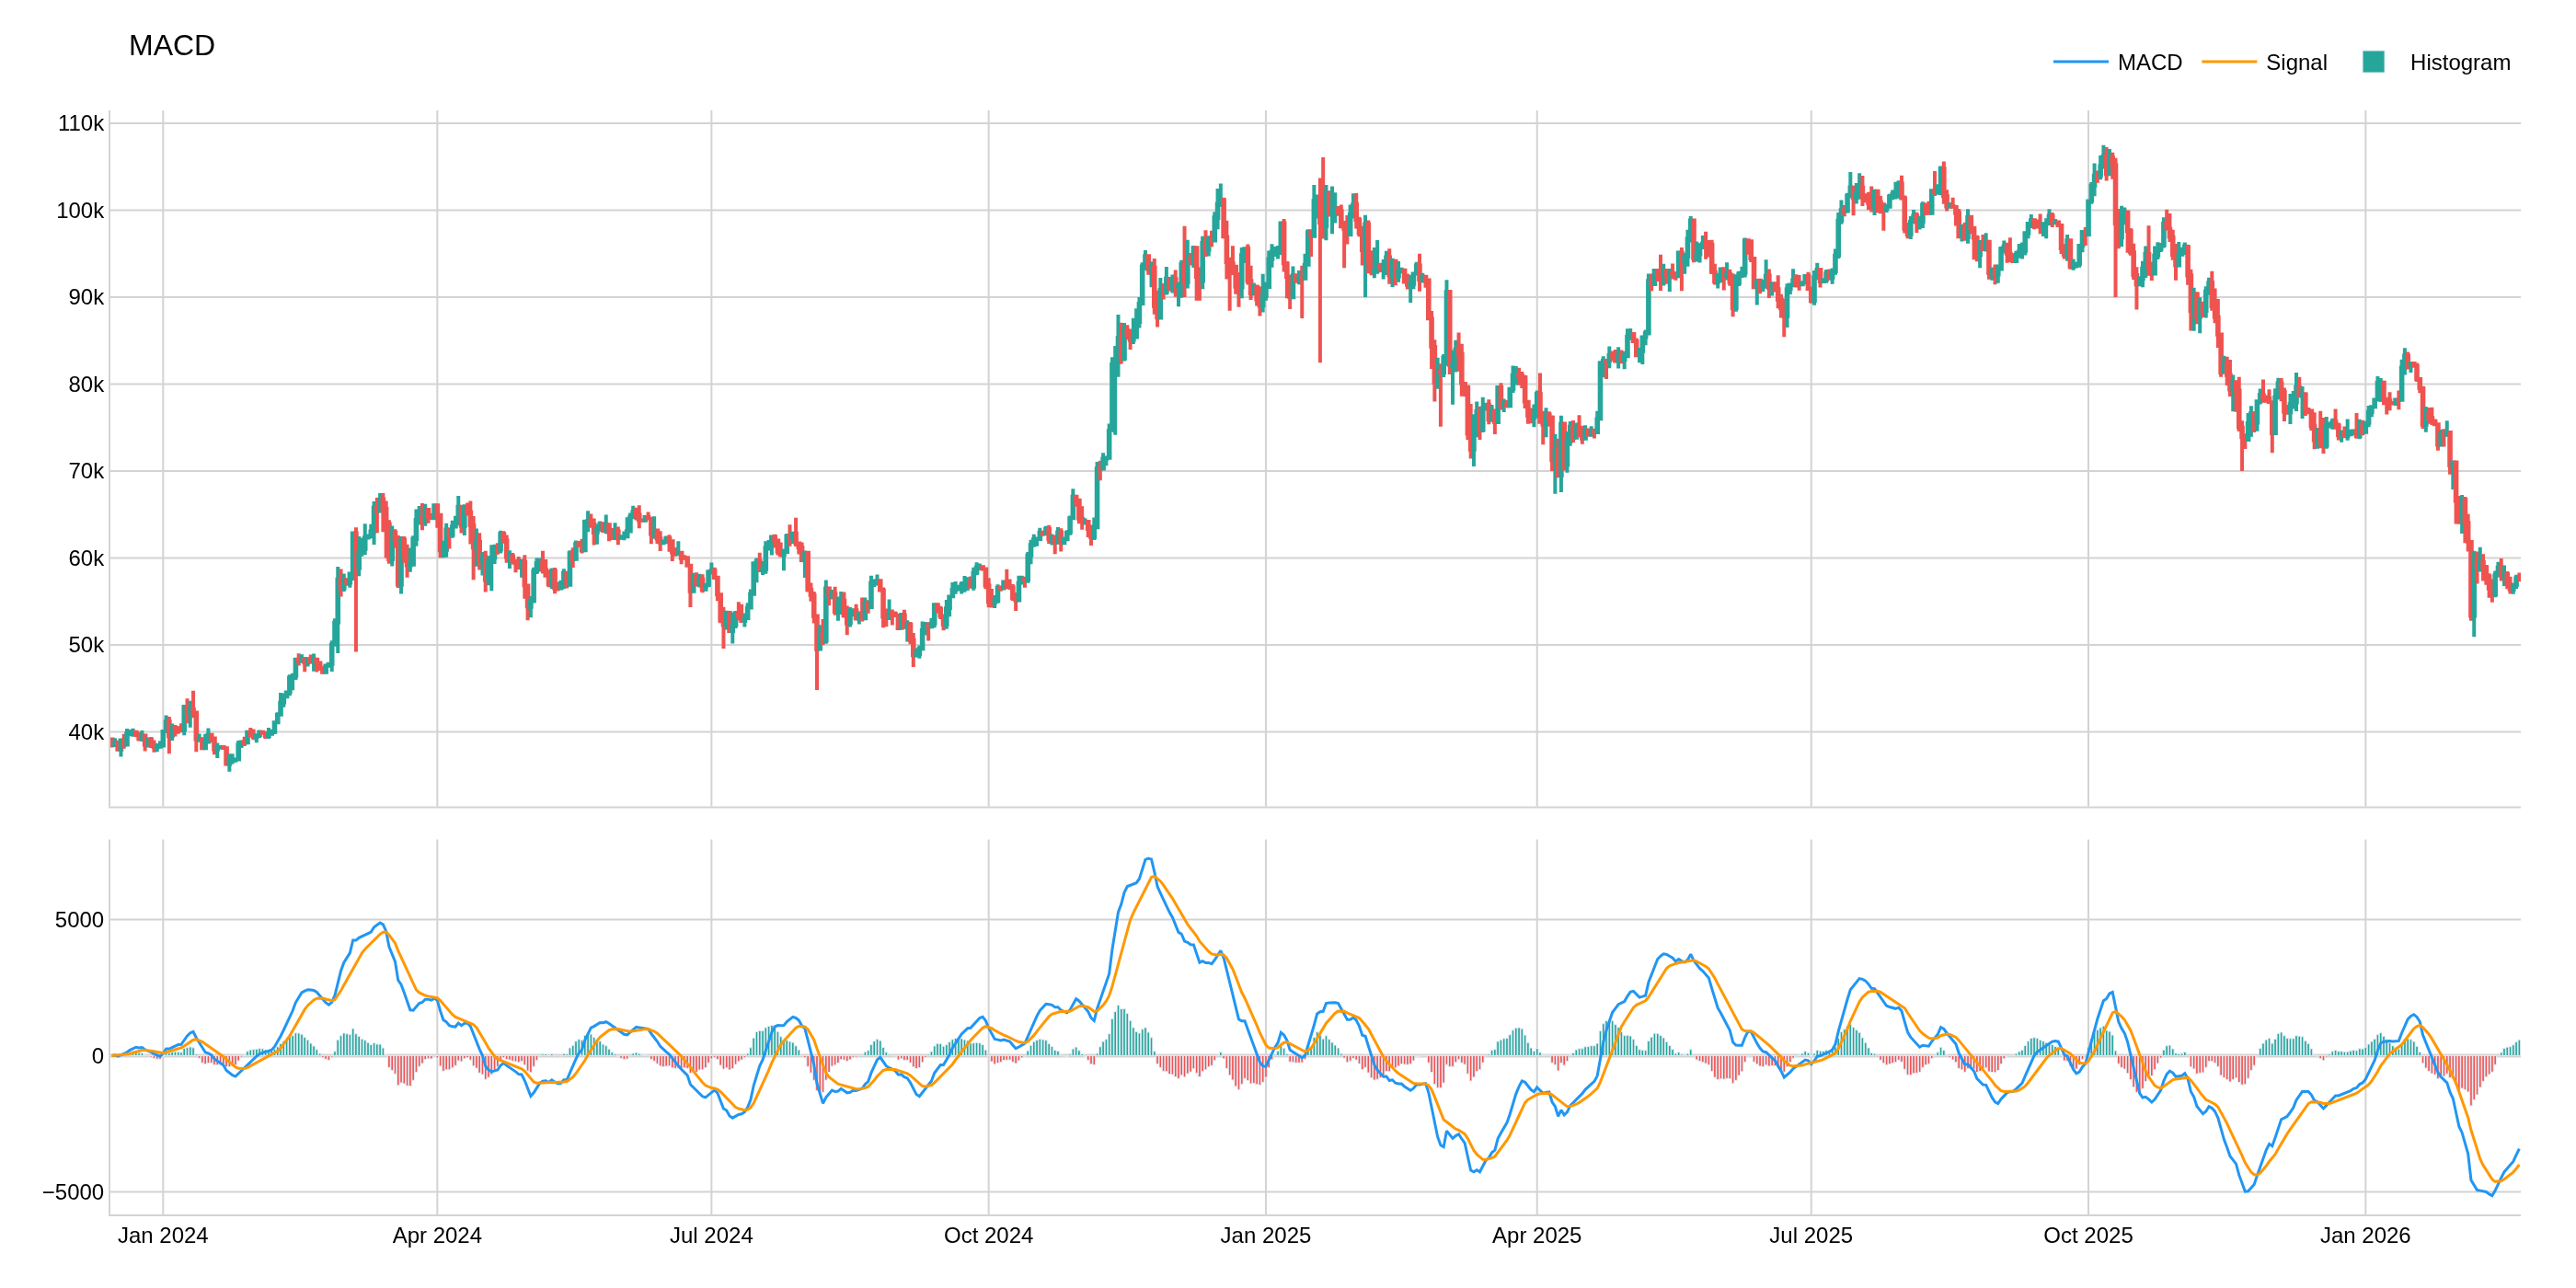
Moving Average Convergence Divergence (MACD)
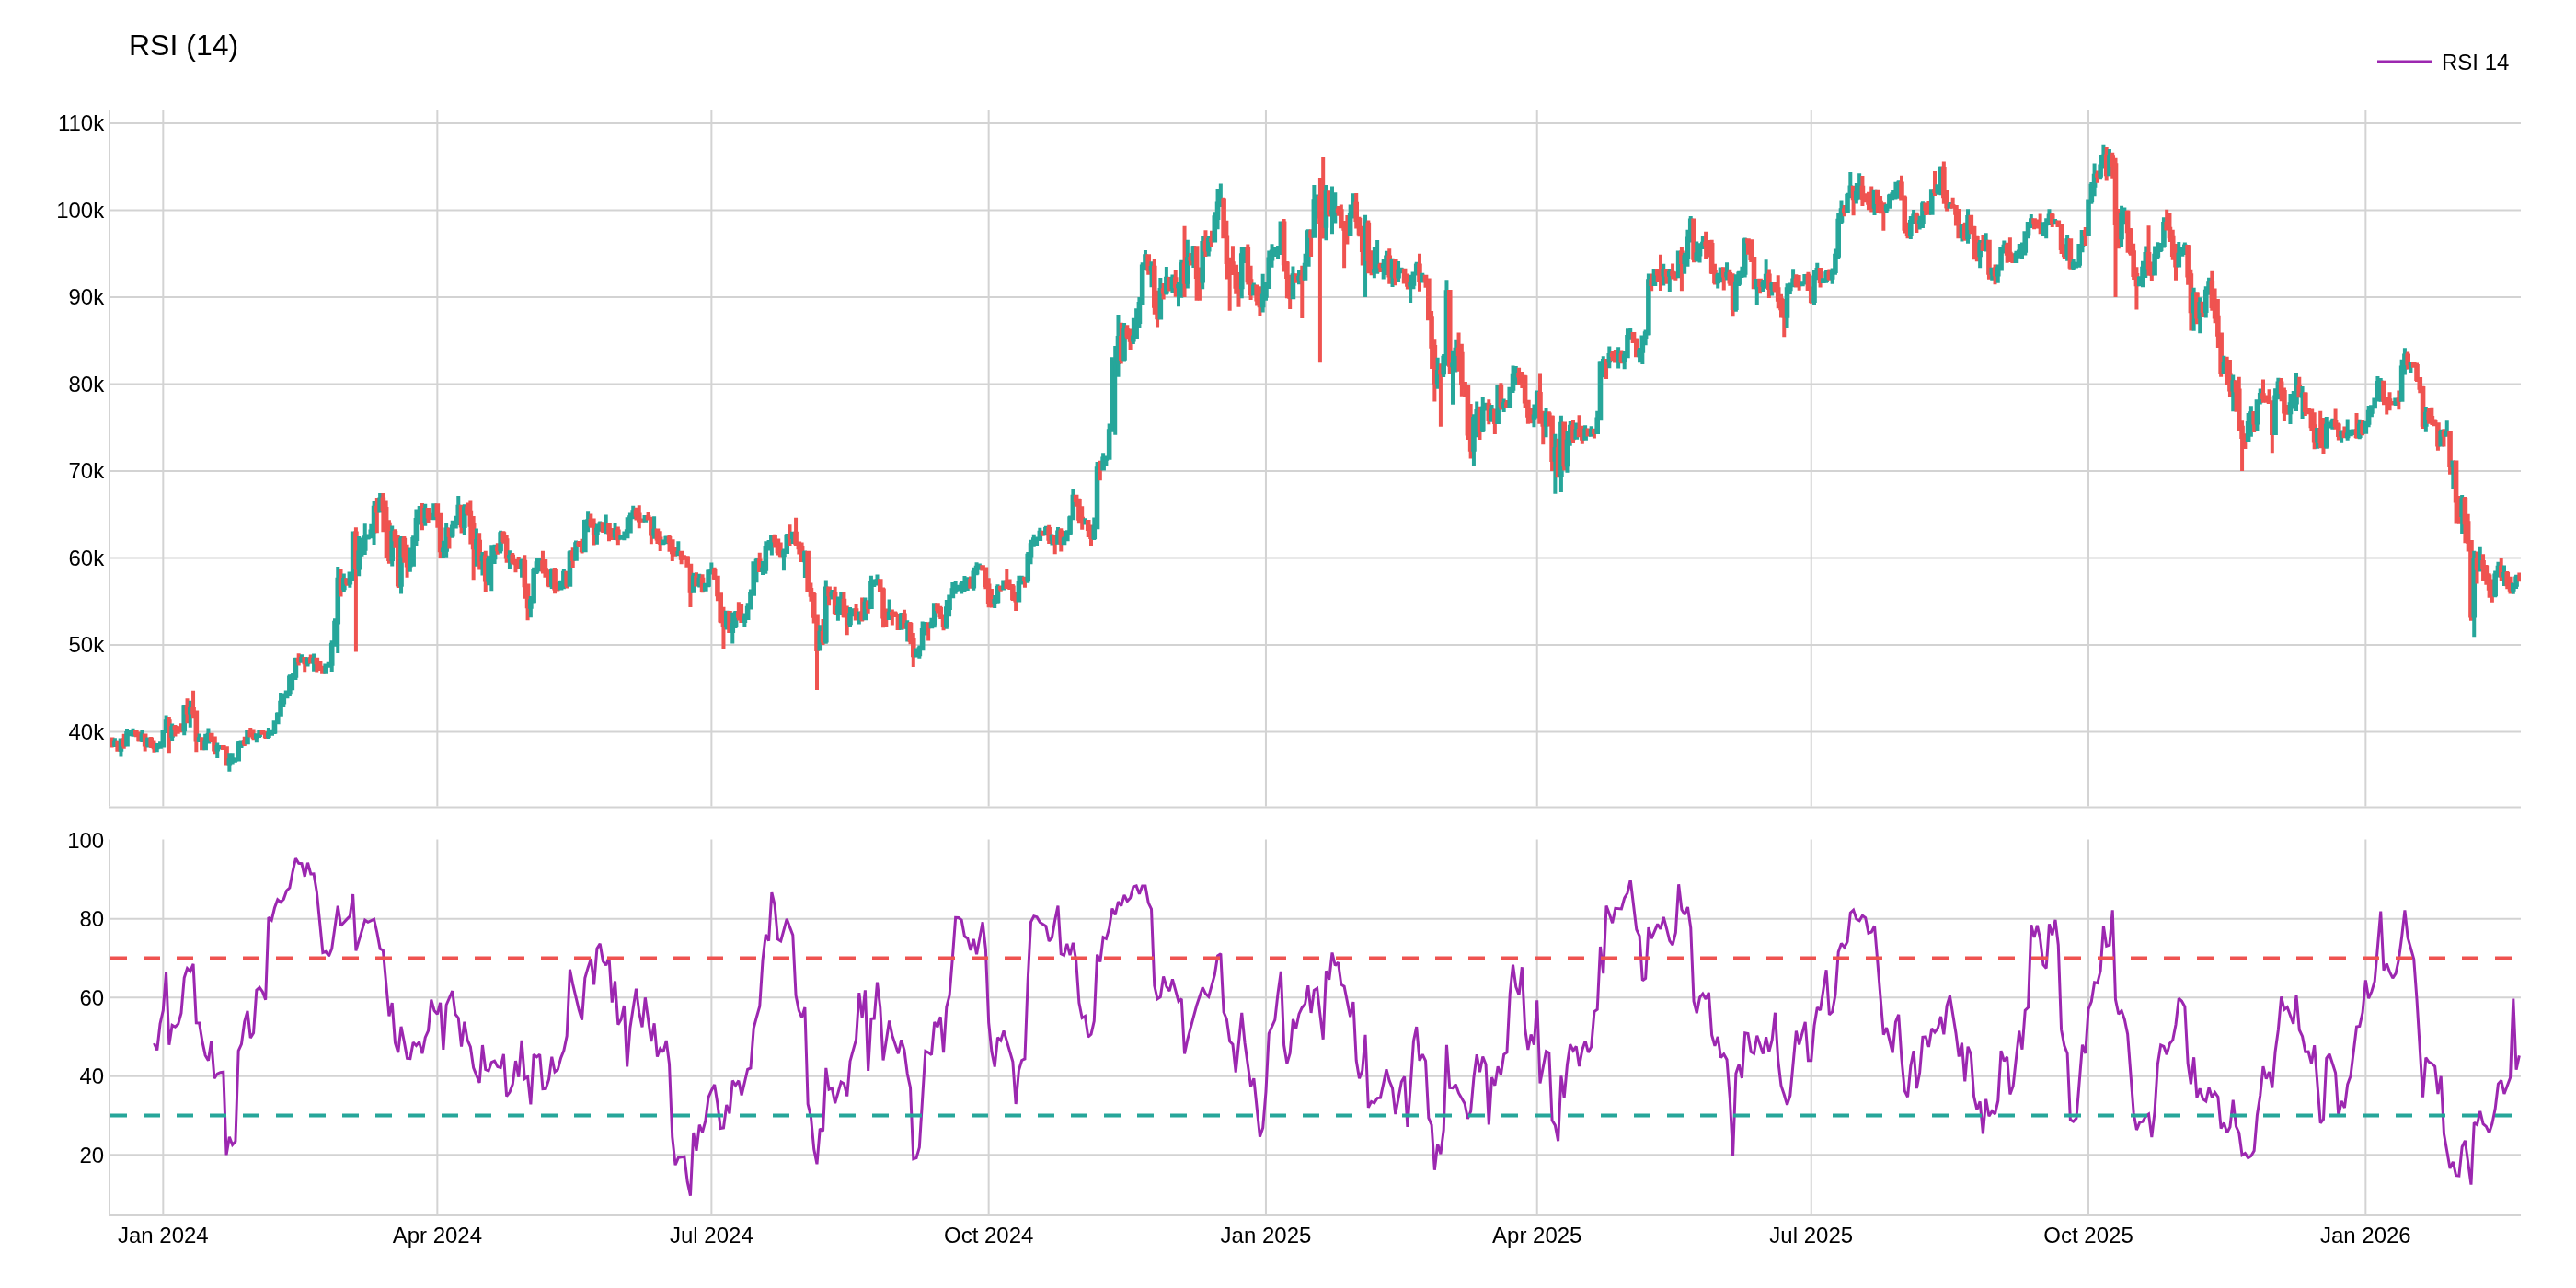
Relative Strength Index (RSI)
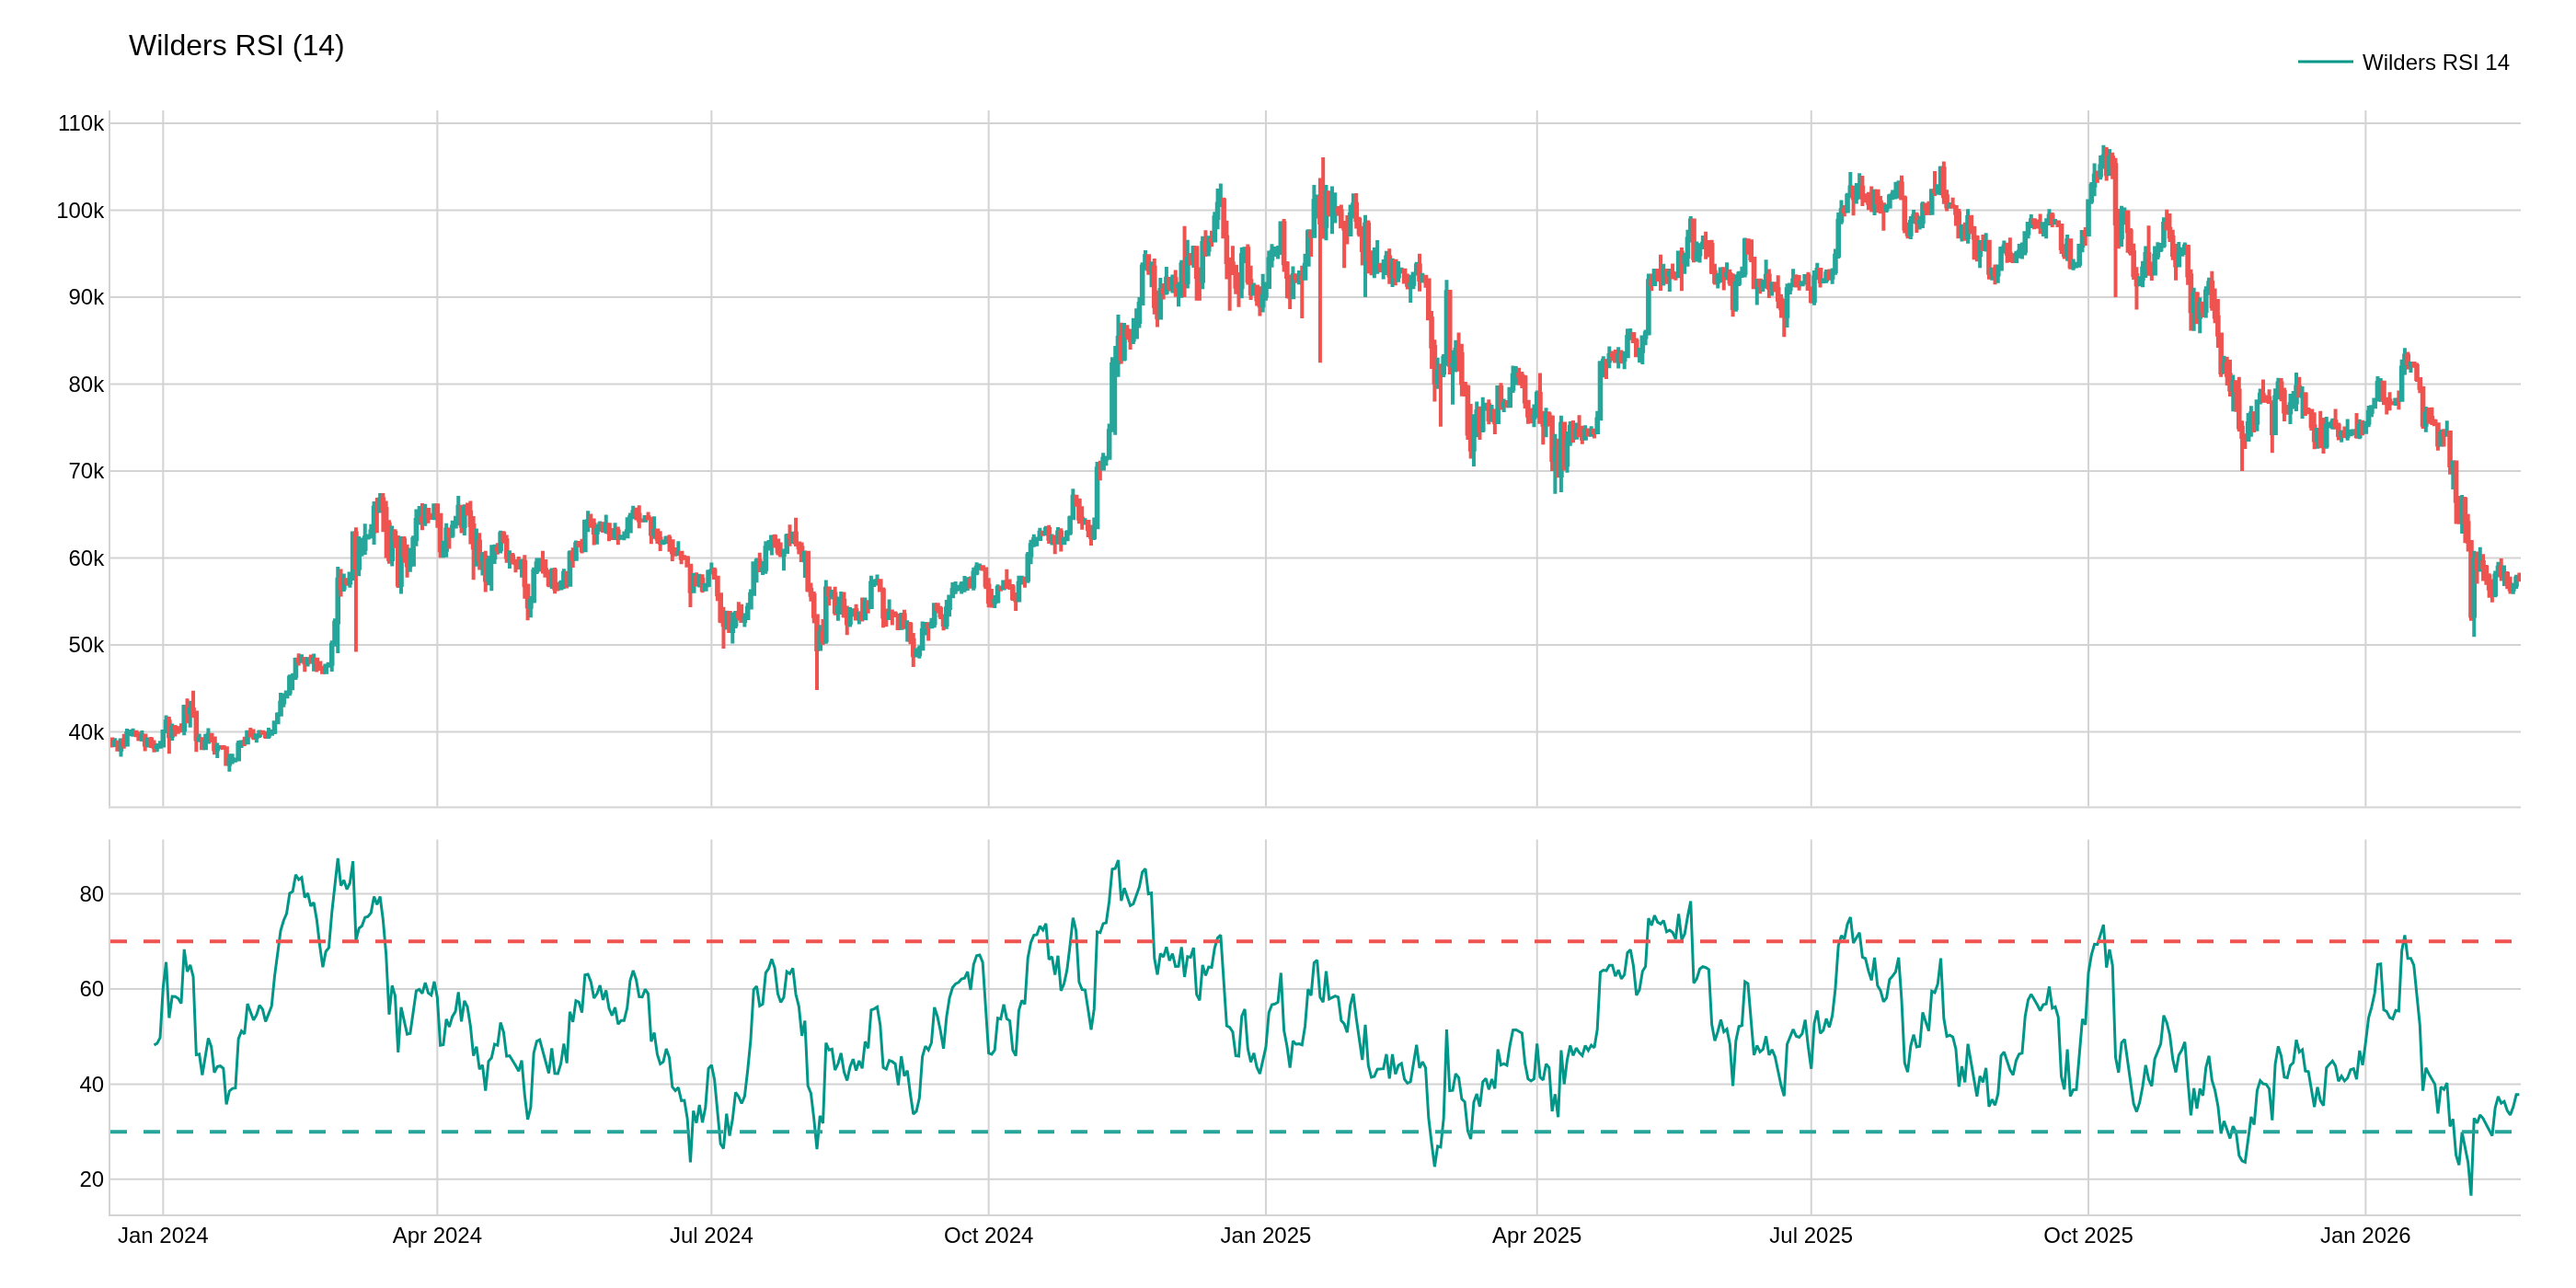
Wilders Relative Strength Index (Wilders RSI)
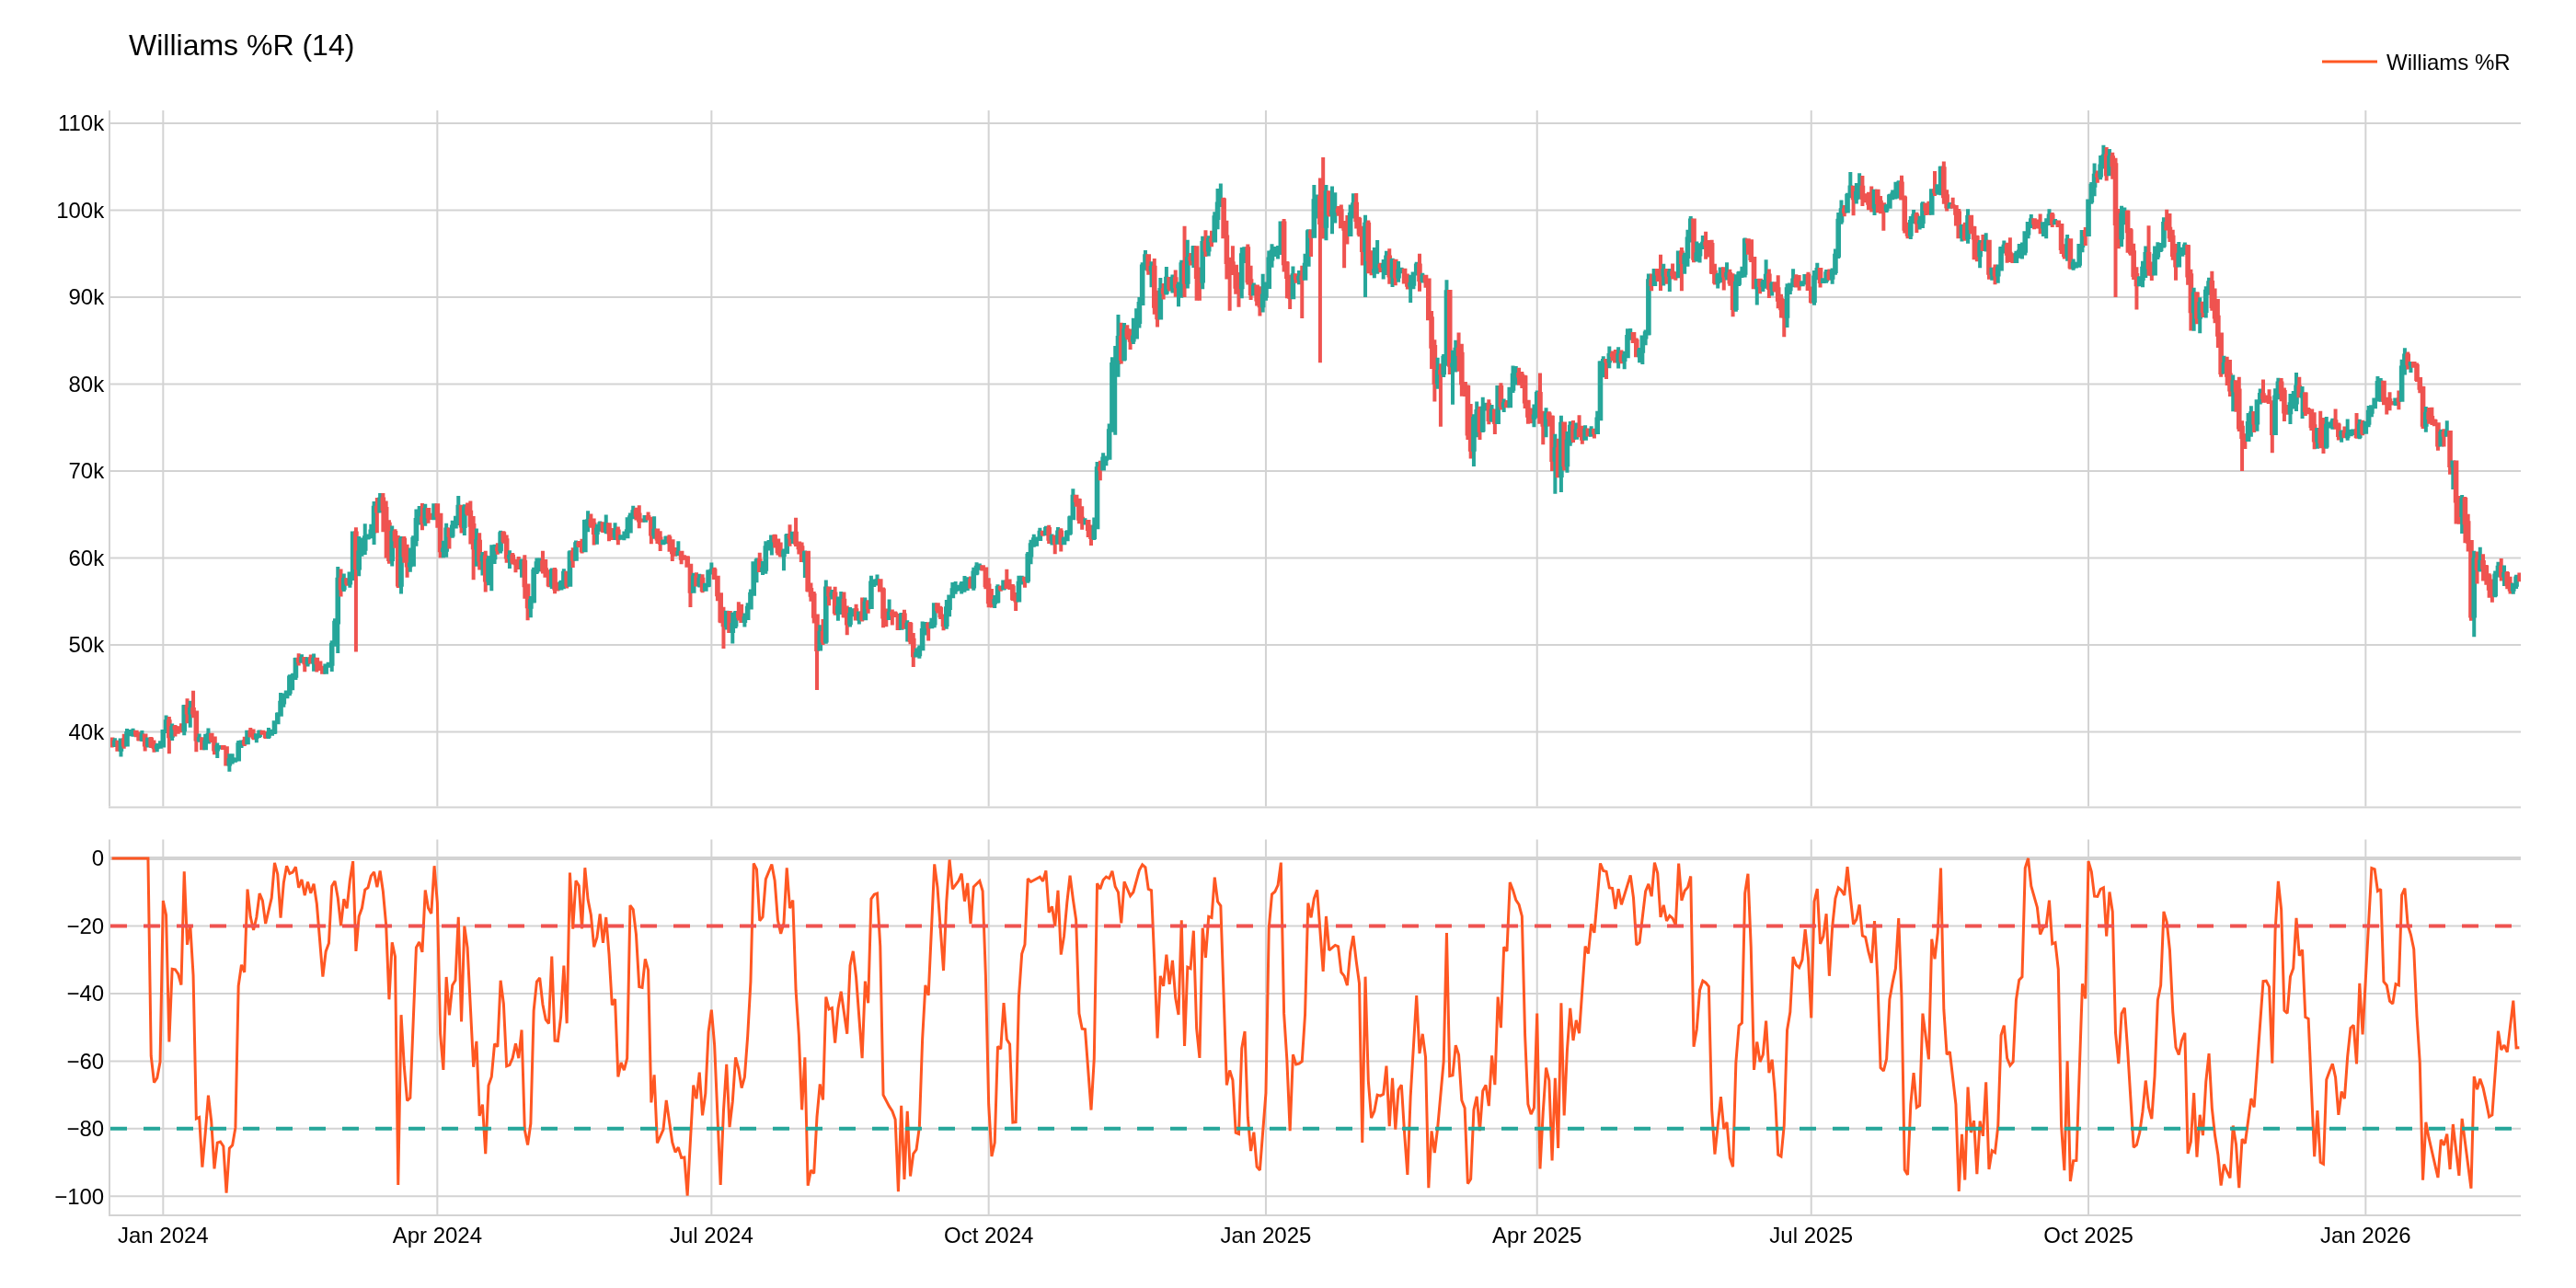
Williams %R
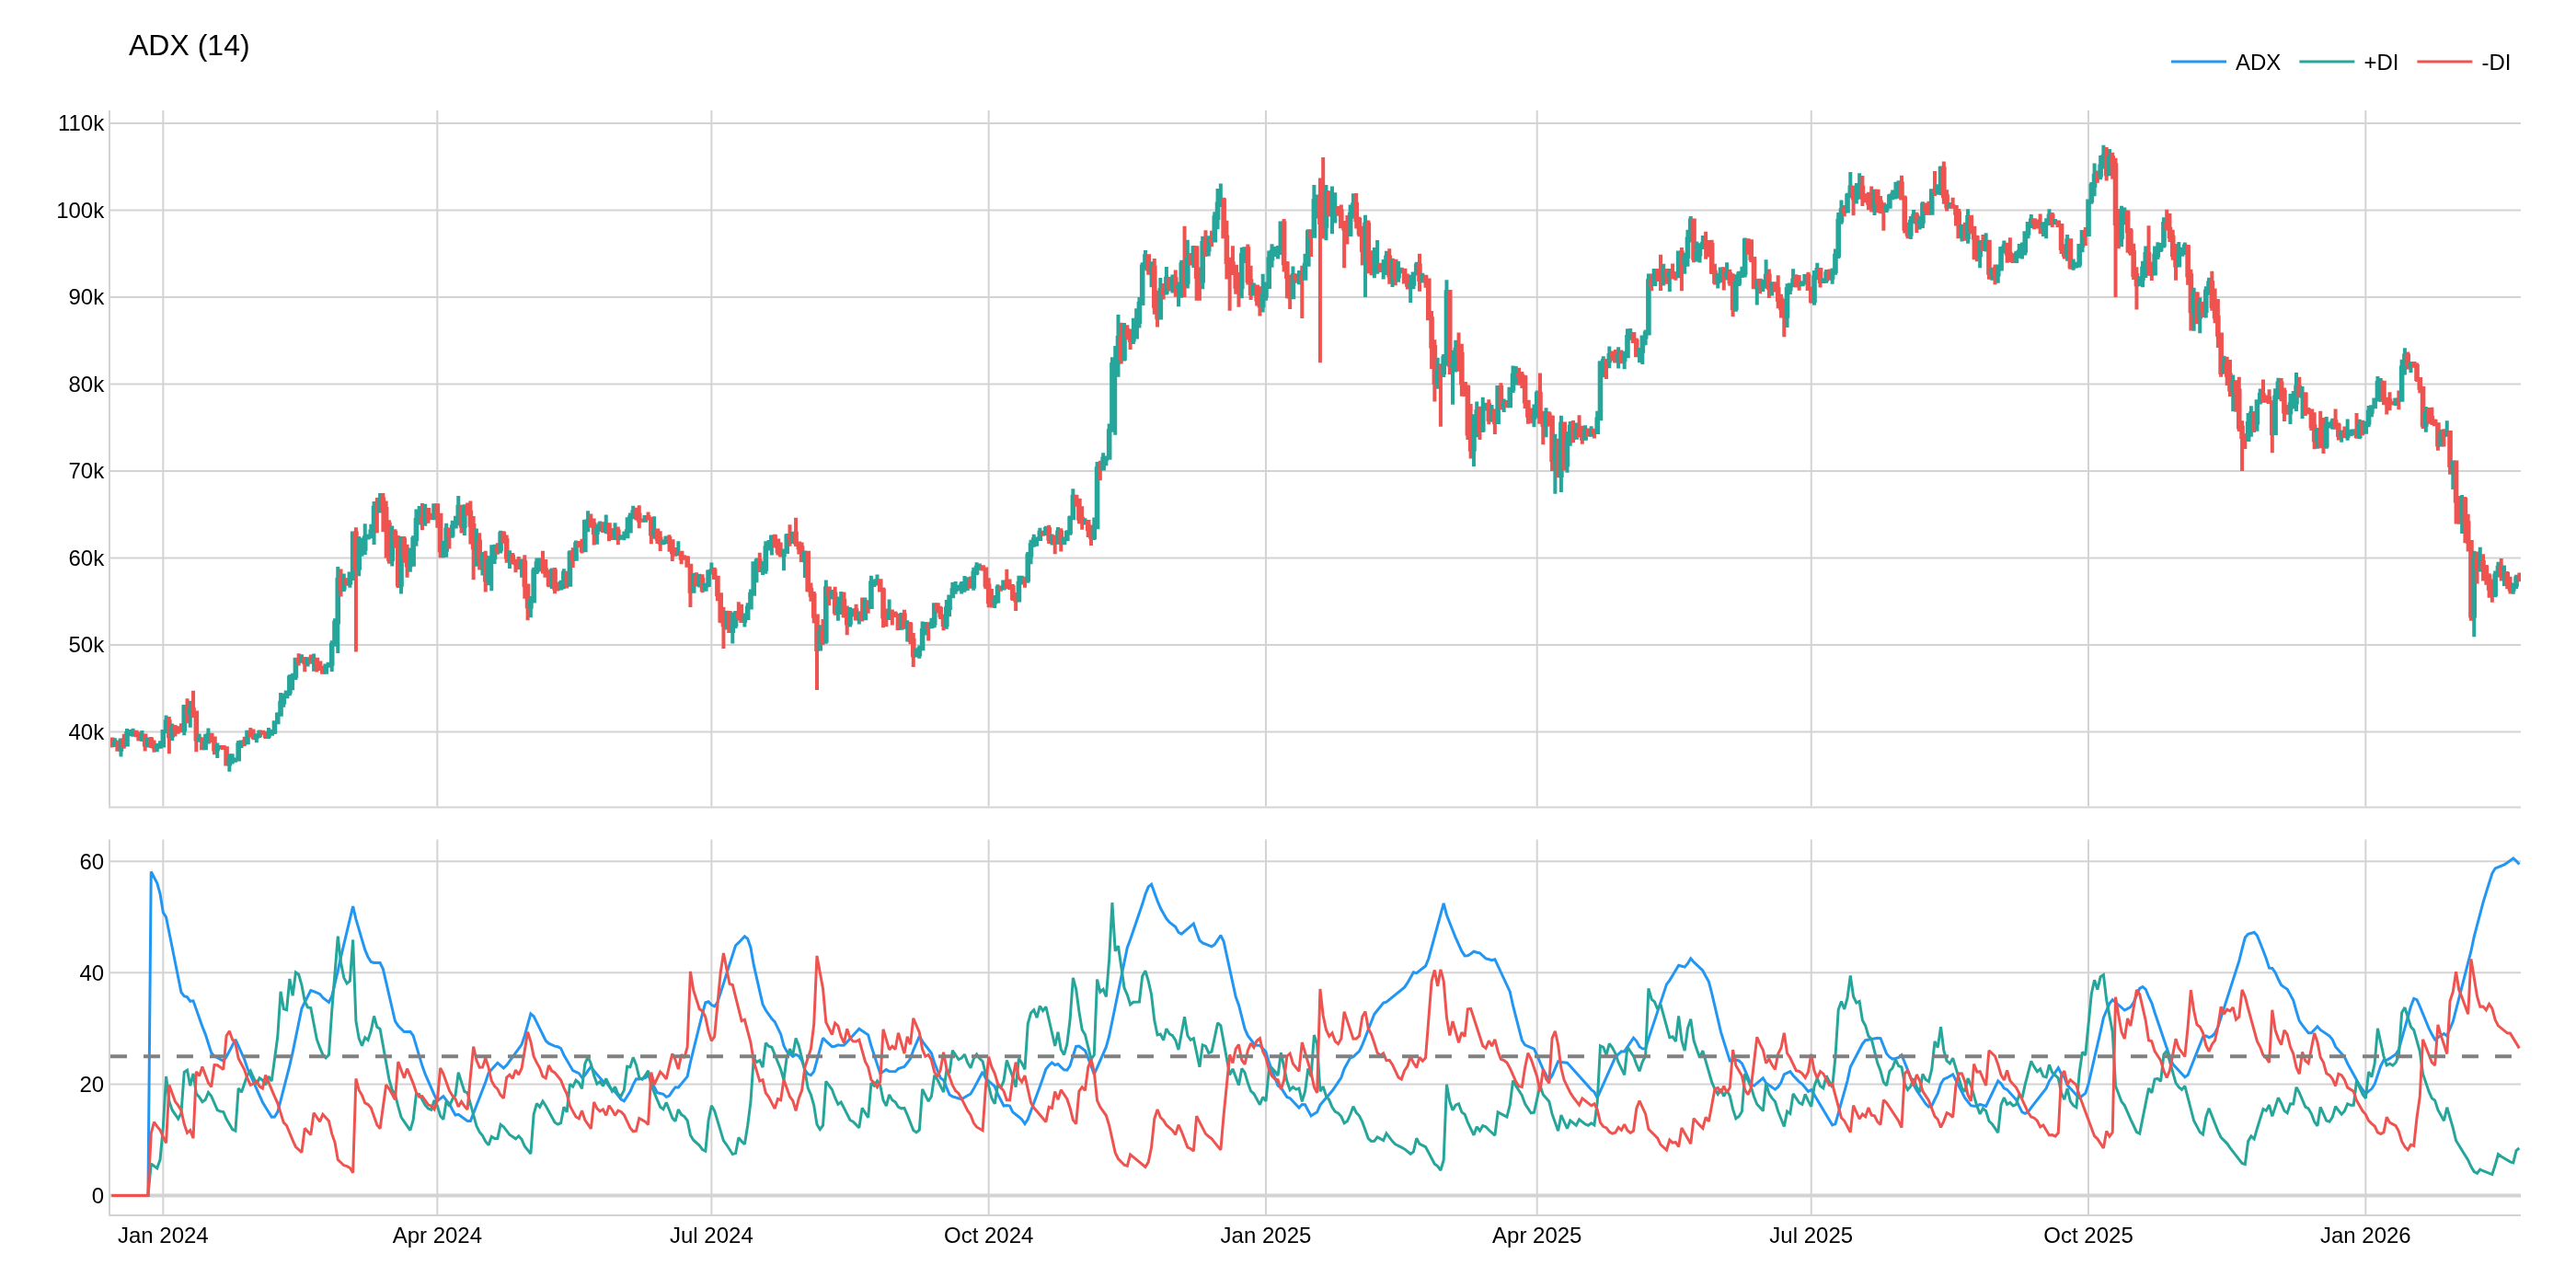
Average Directional Index (ADX)
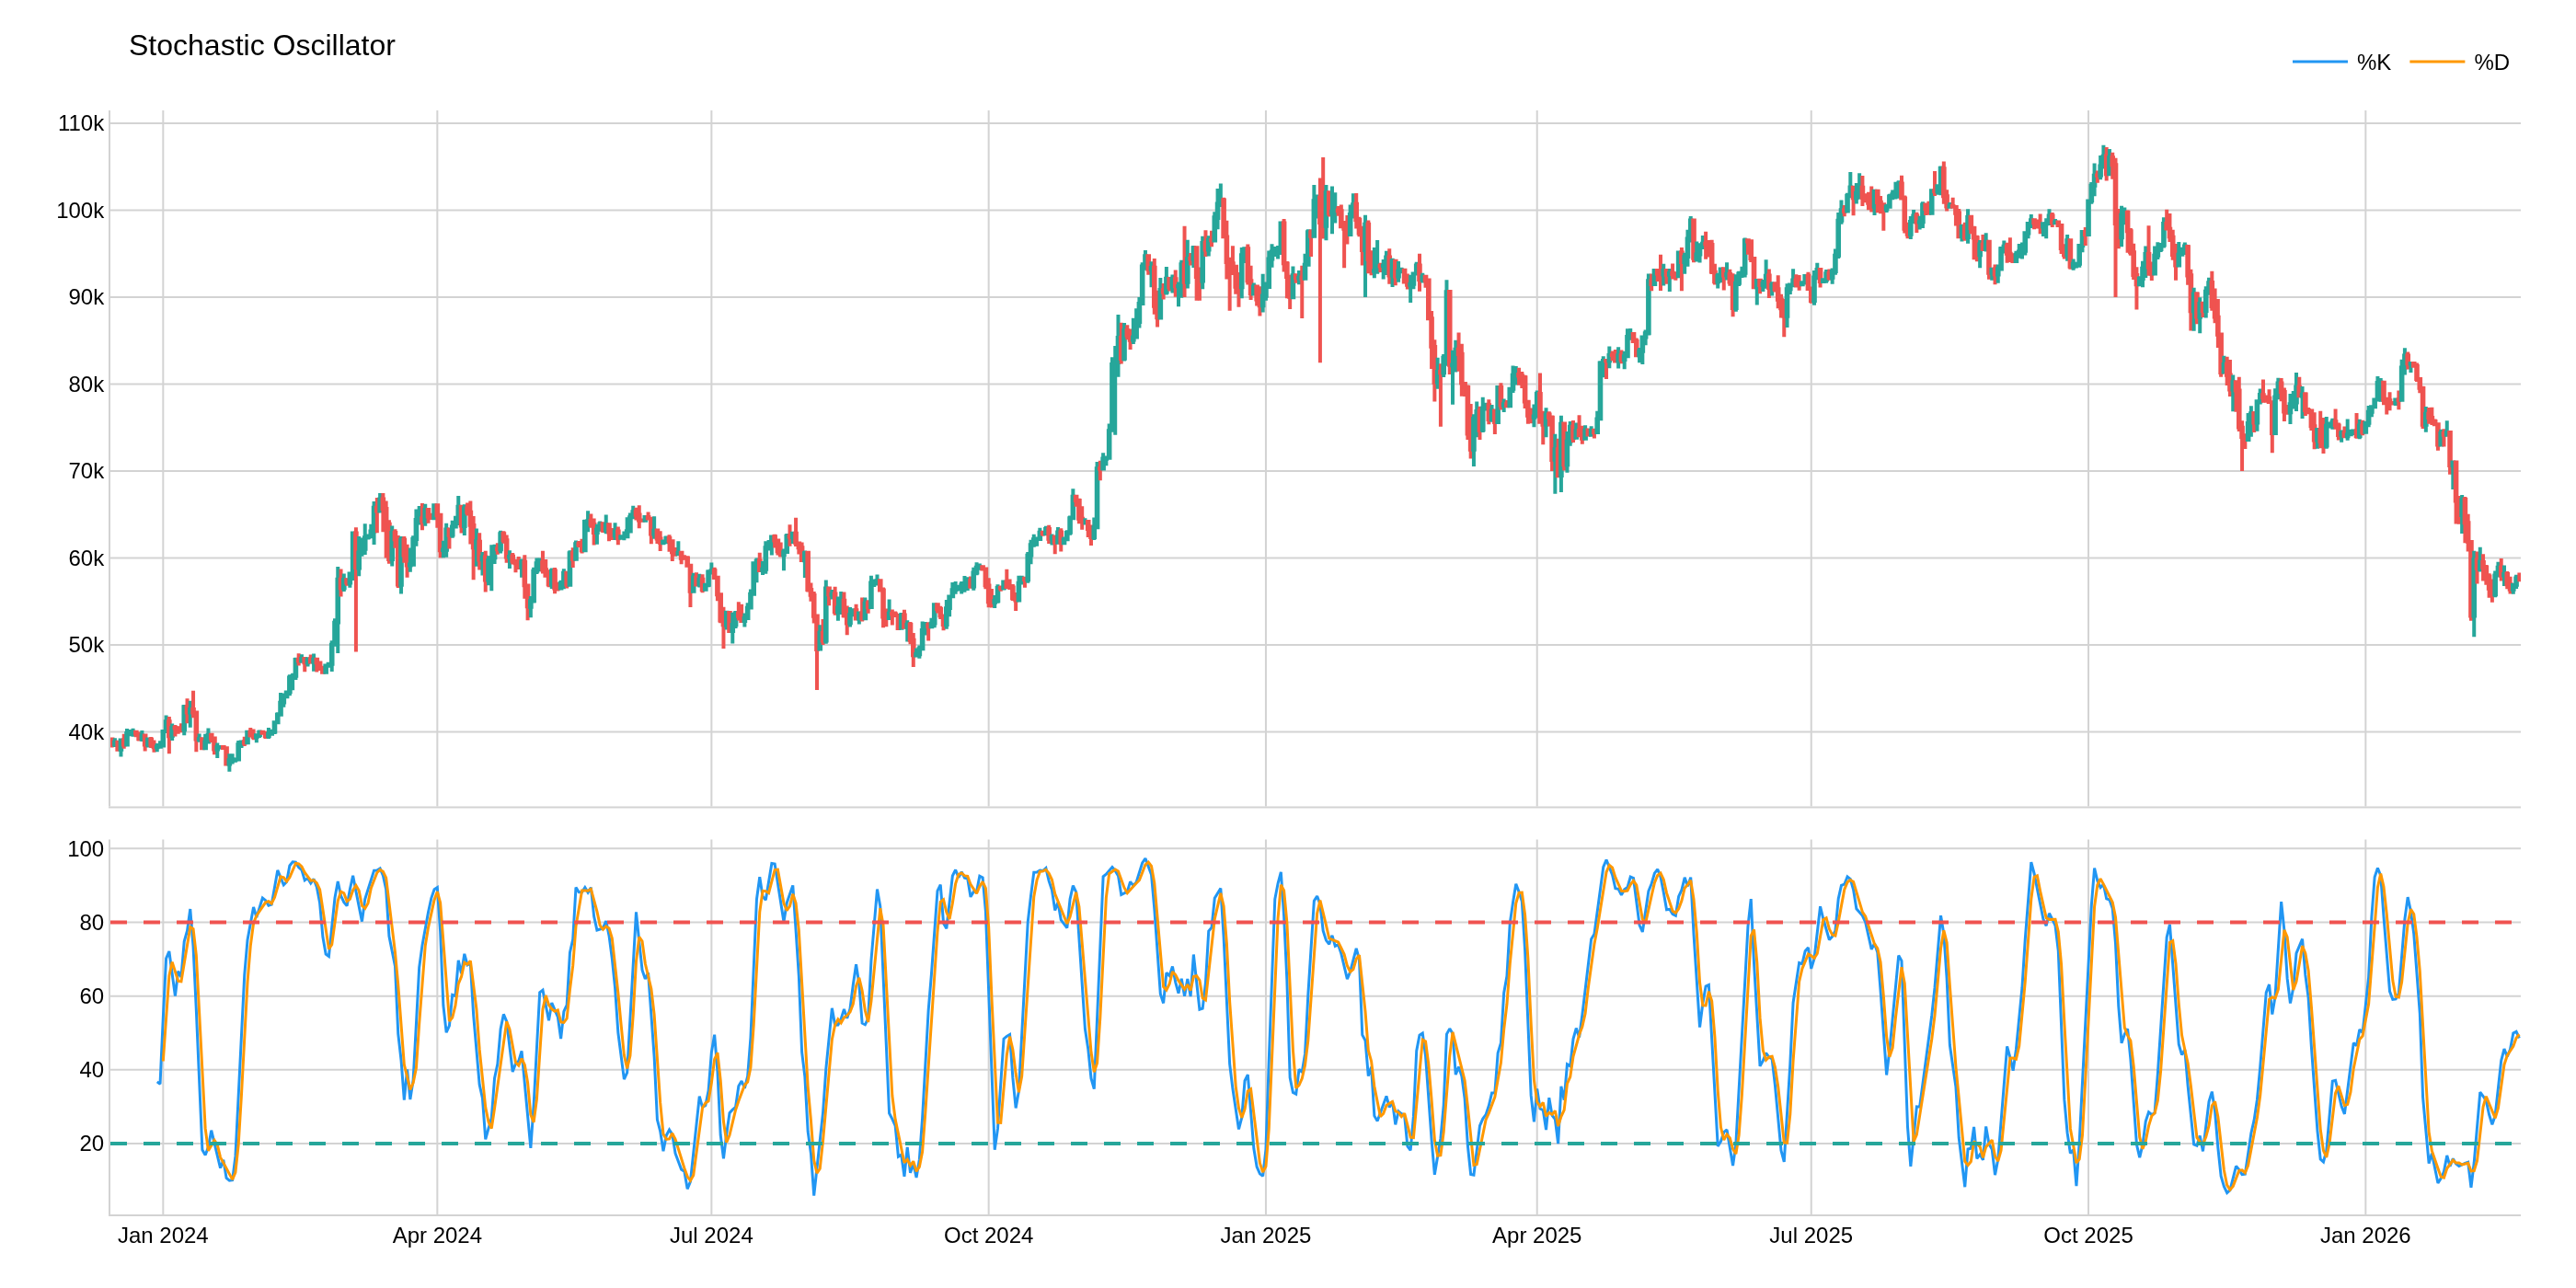
Stochastic Oscillator (STO)
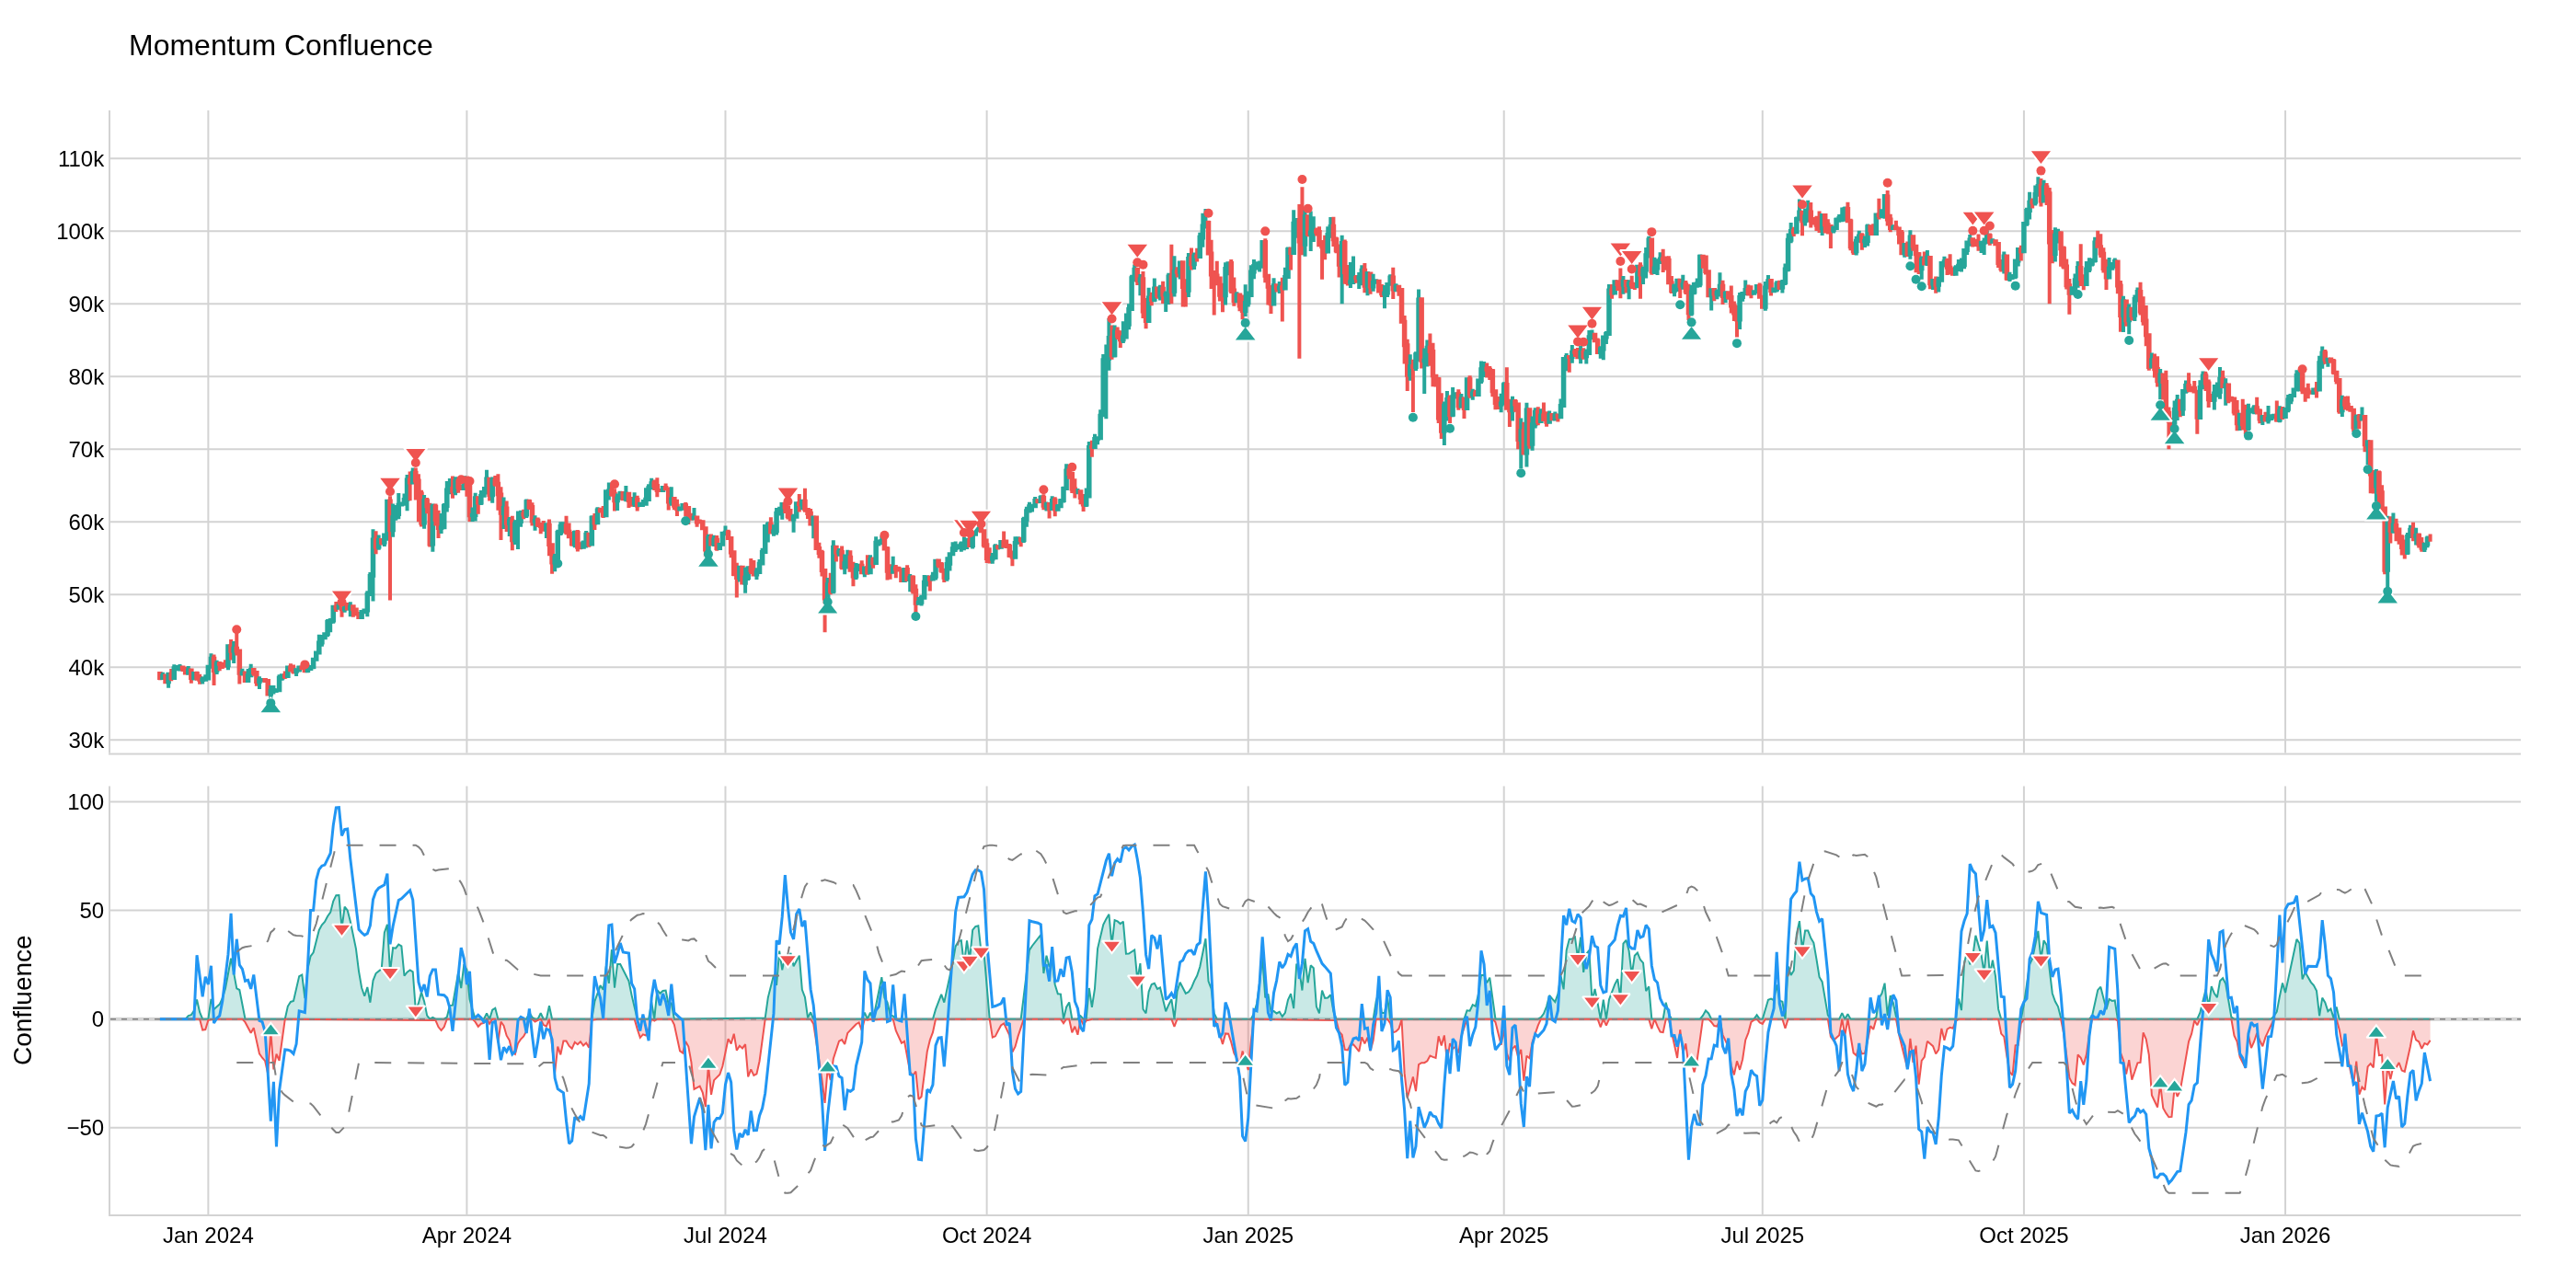
Momentum Confluence
Indicators at a glance
| Indicator | Type | Warmup | Lag | When to use |
|---|---|---|---|---|
| Moving Average Convergence Divergence (MACD) | 🔴 Lagging | long_period + signal_period bars | ≈ long_period / 2 bars | The workhorse momentum indicator. Use it for trend direction (MACD above zero = bullish), momentum shifts (signal line crossovers), and divergence detection. Works best on daily and higher timeframes. |
| Relative Strength Index (RSI) | 🔴 Lagging | period bars | ≈ period bars | The most widely used oscillator. Use it to spot overbought (>70) and oversold (<30) conditions, detect momentum divergences, and confirm trend strength. Versatile across all timeframes. |
| Wilders Relative Strength Index (Wilders RSI) | 🔴 Lagging | period bars | ≈ 2 × period bars | Wilder's original RSI with heavier smoothing. Use it when you want fewer but more reliable overbought/oversold signals. The extra lag filters out short-lived extremes. |
| Williams %R | 🔴 Lagging | period bars | ≈ period / 2 bars | A fast oscillator ideal for timing entries. Use it in ranging markets to spot when price is near the top or bottom of its recent range. Works well in combination with a trend filter. |
| Average Directional Index (ADX) | 🔴 Lagging | 2 × period bars | ≈ 2 × period bars | Measures trend strength without regard to direction. Use ADX > 25 to confirm a strong trend is in place (and avoid range-bound strategies), or ADX < 20 to identify consolidation (and avoid trend-following strategies). |
| Stochastic Oscillator (STO) | 🔴 Lagging | k_period + k_slowing + d_period bars | ≈ k_period / 2 + k_slowing / 2 bars | Compares closing price to its recent range. Use it for overbought/oversold signals in sideways markets, and for %K/%D crossovers as entry triggers. Combine with a trend filter for best results. |
| Momentum Confluence | 🔴 Lagging | max(money_flow_length, trend_wave_length) bars | ≈ max(money_flow_length, trend_wave_length) bars | A composite score that merges RSI, Stochastic, and EMA-based momentum into a single value. Use it when you want one number to summarize overall momentum across multiple sub-indicators. |
Detailed descriptions
Moving Average Convergence Divergence (MACD)
🔴 Lagging — ≈
long_period / 2barsWarmup:
long_period + signal_periodbars (default: 35 bars (long_period=26, signal_period=9))
The workhorse momentum indicator. Use it for trend direction (MACD above zero = bullish), momentum shifts (signal line crossovers), and divergence detection. Works best on daily and higher timeframes.
Relative Strength Index (RSI)
🔴 Lagging — ≈
periodbarsWarmup:
periodbars (default: 14 bars (period=14))
The most widely used oscillator. Use it to spot overbought (>70) and oversold (<30) conditions, detect momentum divergences, and confirm trend strength. Versatile across all timeframes.
Wilders Relative Strength Index (Wilders RSI)
🔴 Lagging — ≈
2 × periodbarsWarmup:
periodbars (default: 14 bars (period=14))
Wilder's original RSI with heavier smoothing. Use it when you want fewer but more reliable overbought/oversold signals. The extra lag filters out short-lived extremes.
Williams %R
🔴 Lagging — ≈
period / 2barsWarmup:
periodbars (default: 14 bars (period=14))
A fast oscillator ideal for timing entries. Use it in ranging markets to spot when price is near the top or bottom of its recent range. Works well in combination with a trend filter.
Average Directional Index (ADX)
🔴 Lagging — ≈
2 × periodbarsWarmup:
2 × periodbars (default: 28 bars (period=14))
Measures trend strength without regard to direction. Use ADX > 25 to confirm a strong trend is in place (and avoid range-bound strategies), or ADX < 20 to identify consolidation (and avoid trend-following strategies).
Stochastic Oscillator (STO)
🔴 Lagging — ≈
k_period / 2 + k_slowing / 2barsWarmup:
k_period + k_slowing + d_periodbars (default: 20 bars (k_period=14, k_slowing=3, d_period=3))
Compares closing price to its recent range. Use it for overbought/oversold signals in sideways markets, and for %K/%D crossovers as entry triggers. Combine with a trend filter for best results.
Momentum Confluence
🔴 Lagging — ≈
max(money_flow_length, trend_wave_length)barsWarmup:
max(money_flow_length, trend_wave_length)bars (default: 14 bars (money_flow_length=14))
A composite score that merges RSI, Stochastic, and EMA-based momentum into a single value. Use it when you want one number to summarize overall momentum across multiple sub-indicators.