Pattern Recognition
Pattern recognition indicators automatically detect recurring price structures such as peaks, troughs, and divergences. They are real-time but require a confirmation delay of several bars to validate each pattern. Use them for systematic scanning of setups that would be time-consuming to spot manually.

Indicators at a glance
| Indicator | Type | Warmup | Lag | When to use |
|---|---|---|---|---|
| Detect Peaks | 🟢 Real-time | 2 × number_of_neighbors_to_compare + 1 bars | ≈ number_of_neighbors_to_compare bars | Identifies local highs (Higher Highs / Lower Highs) and lows (Higher Lows / Lower Lows) in price data. Use it as a building block for trend analysis, divergence detection, and swing structure mapping. |
| Detect Bullish Divergence | 🟢 Real-time | 2 × number_of_neighbors_to_compare + 1 bars | ≈ number_of_neighbors_to_compare bars after the peak | Detects when price makes lower lows but an oscillator (e.g. RSI) makes higher lows — a classic reversal signal. Use it to spot potential bottoms in a downtrend. |
| Detect Bearish Divergence | 🟢 Real-time | 2 × number_of_neighbors_to_compare + 1 bars | ≈ number_of_neighbors_to_compare bars after the peak | Detects when price makes higher highs but an oscillator makes lower highs. Use it to spot potential tops in an uptrend. |
Detailed descriptions
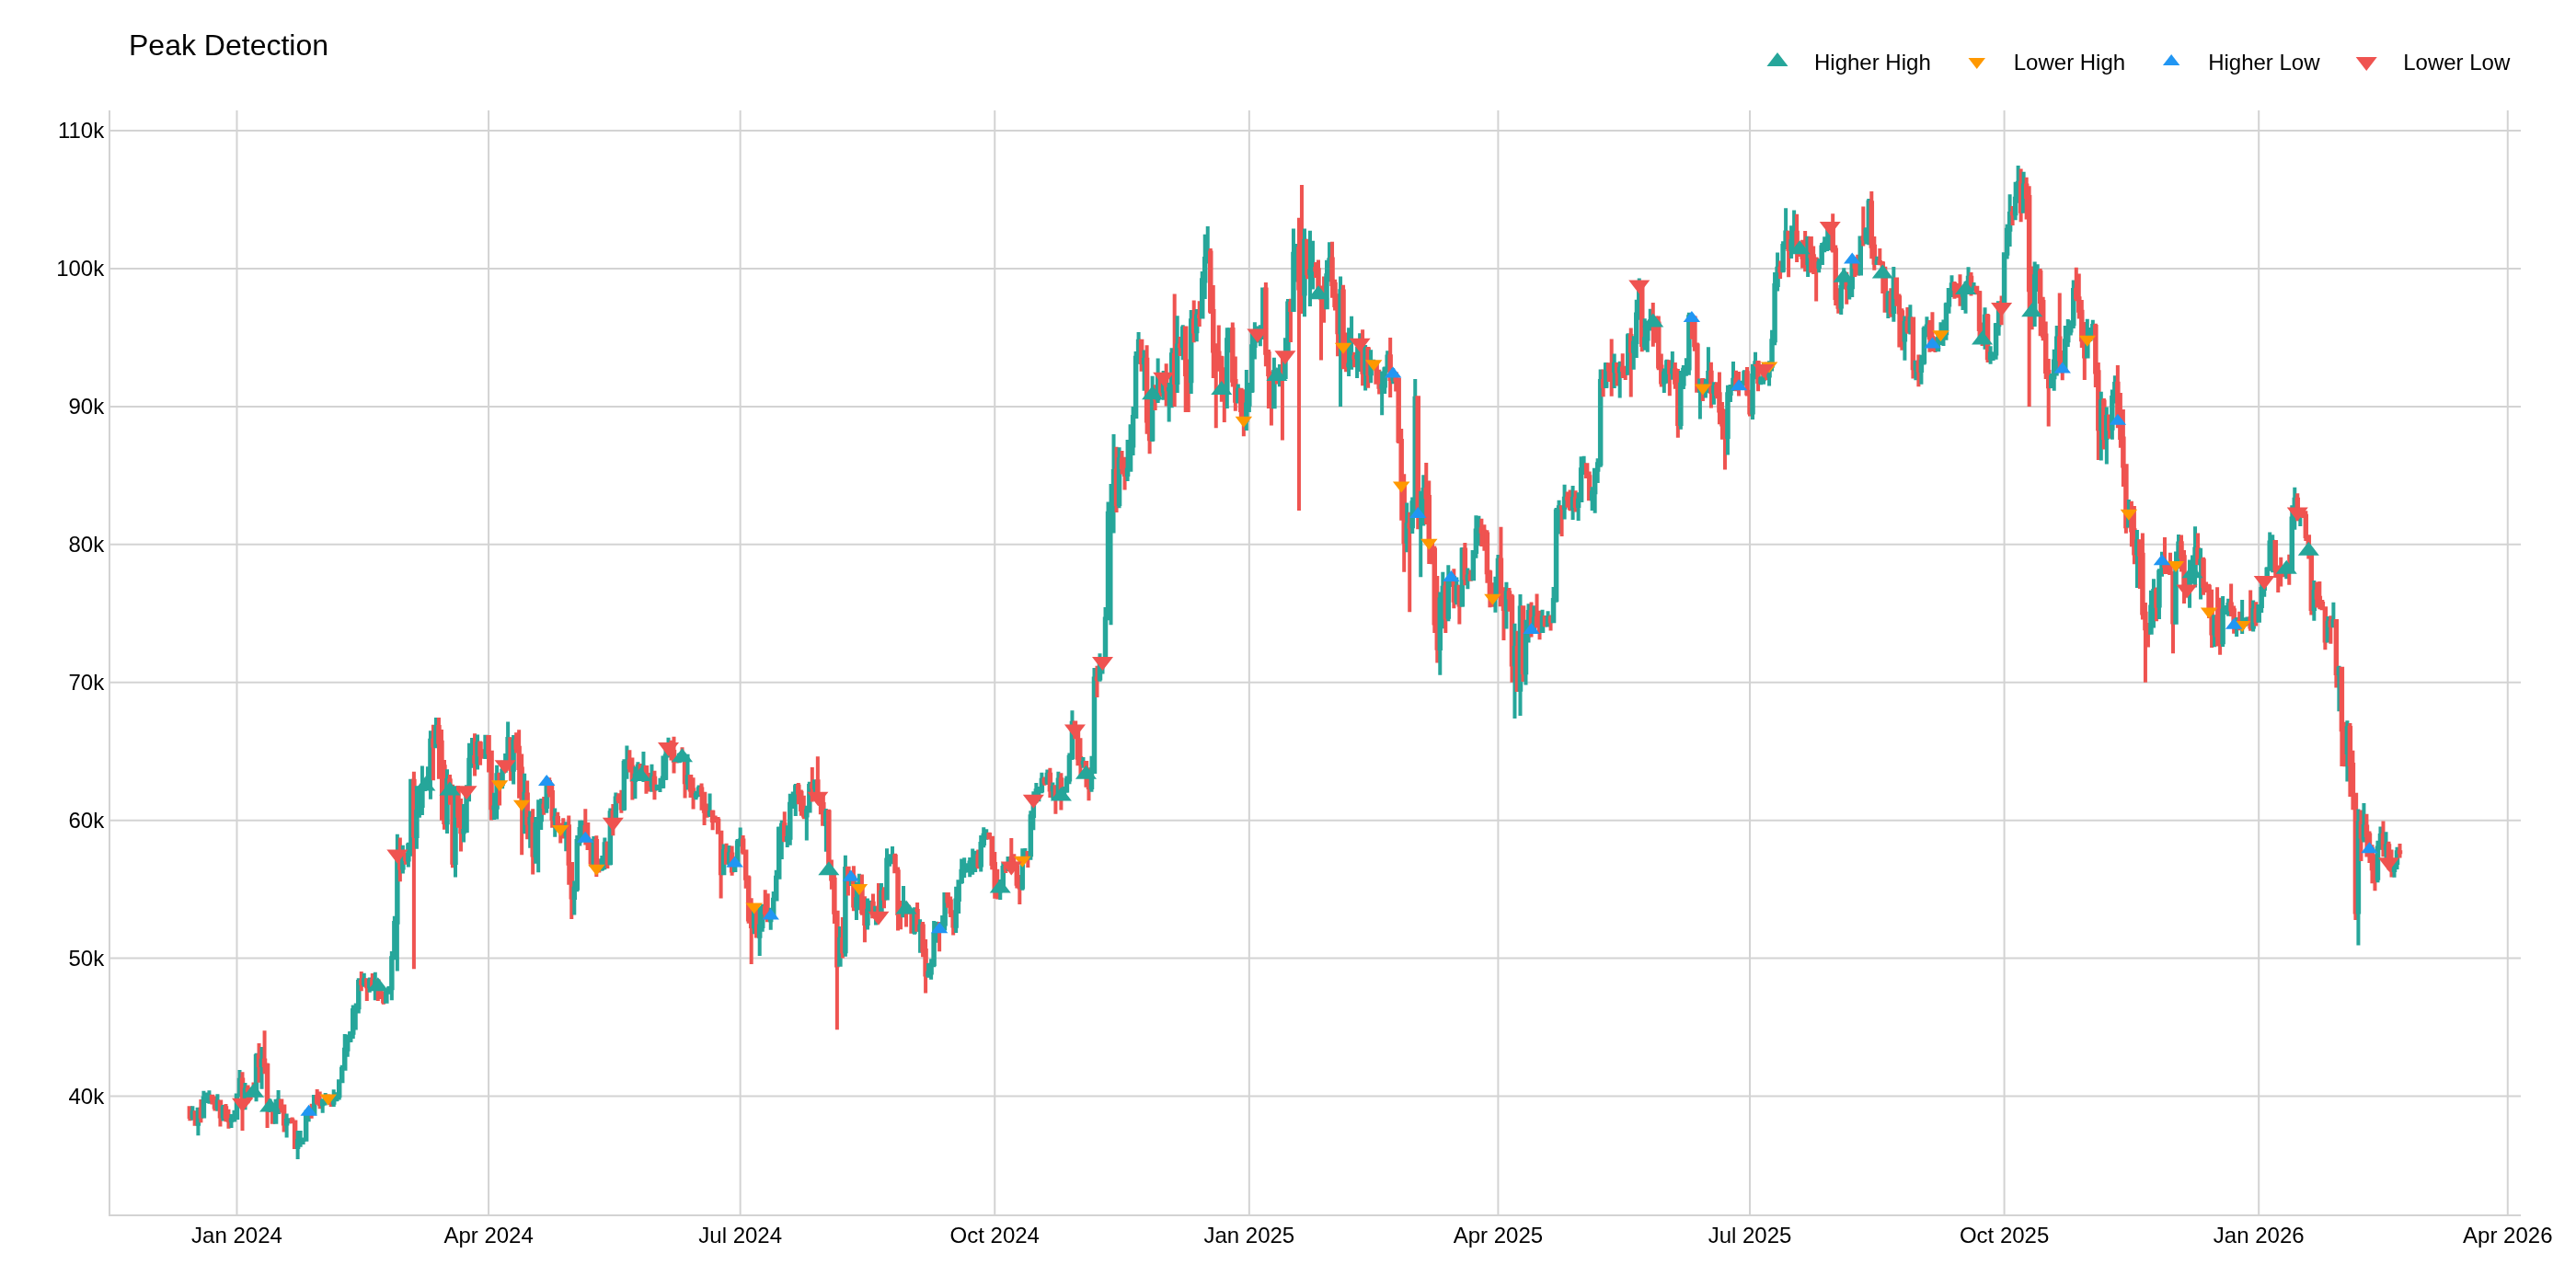
Detect Peaks
🟢 Real-time — ≈
number_of_neighbors_to_comparebarsWarmup:
2 × number_of_neighbors_to_compare + 1bars (default: 11 bars (number_of_neighbors_to_compare=5))
Identifies local highs (Higher Highs / Lower Highs) and lows (Higher Lows / Lower Lows) in price data. Use it as a building block for trend analysis, divergence detection, and swing structure mapping.
Detect Bullish Divergence
🟢 Real-time — ≈
number_of_neighbors_to_comparebars after the peakWarmup:
2 × number_of_neighbors_to_compare + 1bars (default: 11 bars (number_of_neighbors_to_compare=5))
Detects when price makes lower lows but an oscillator (e.g. RSI) makes higher lows — a classic reversal signal. Use it to spot potential bottoms in a downtrend.
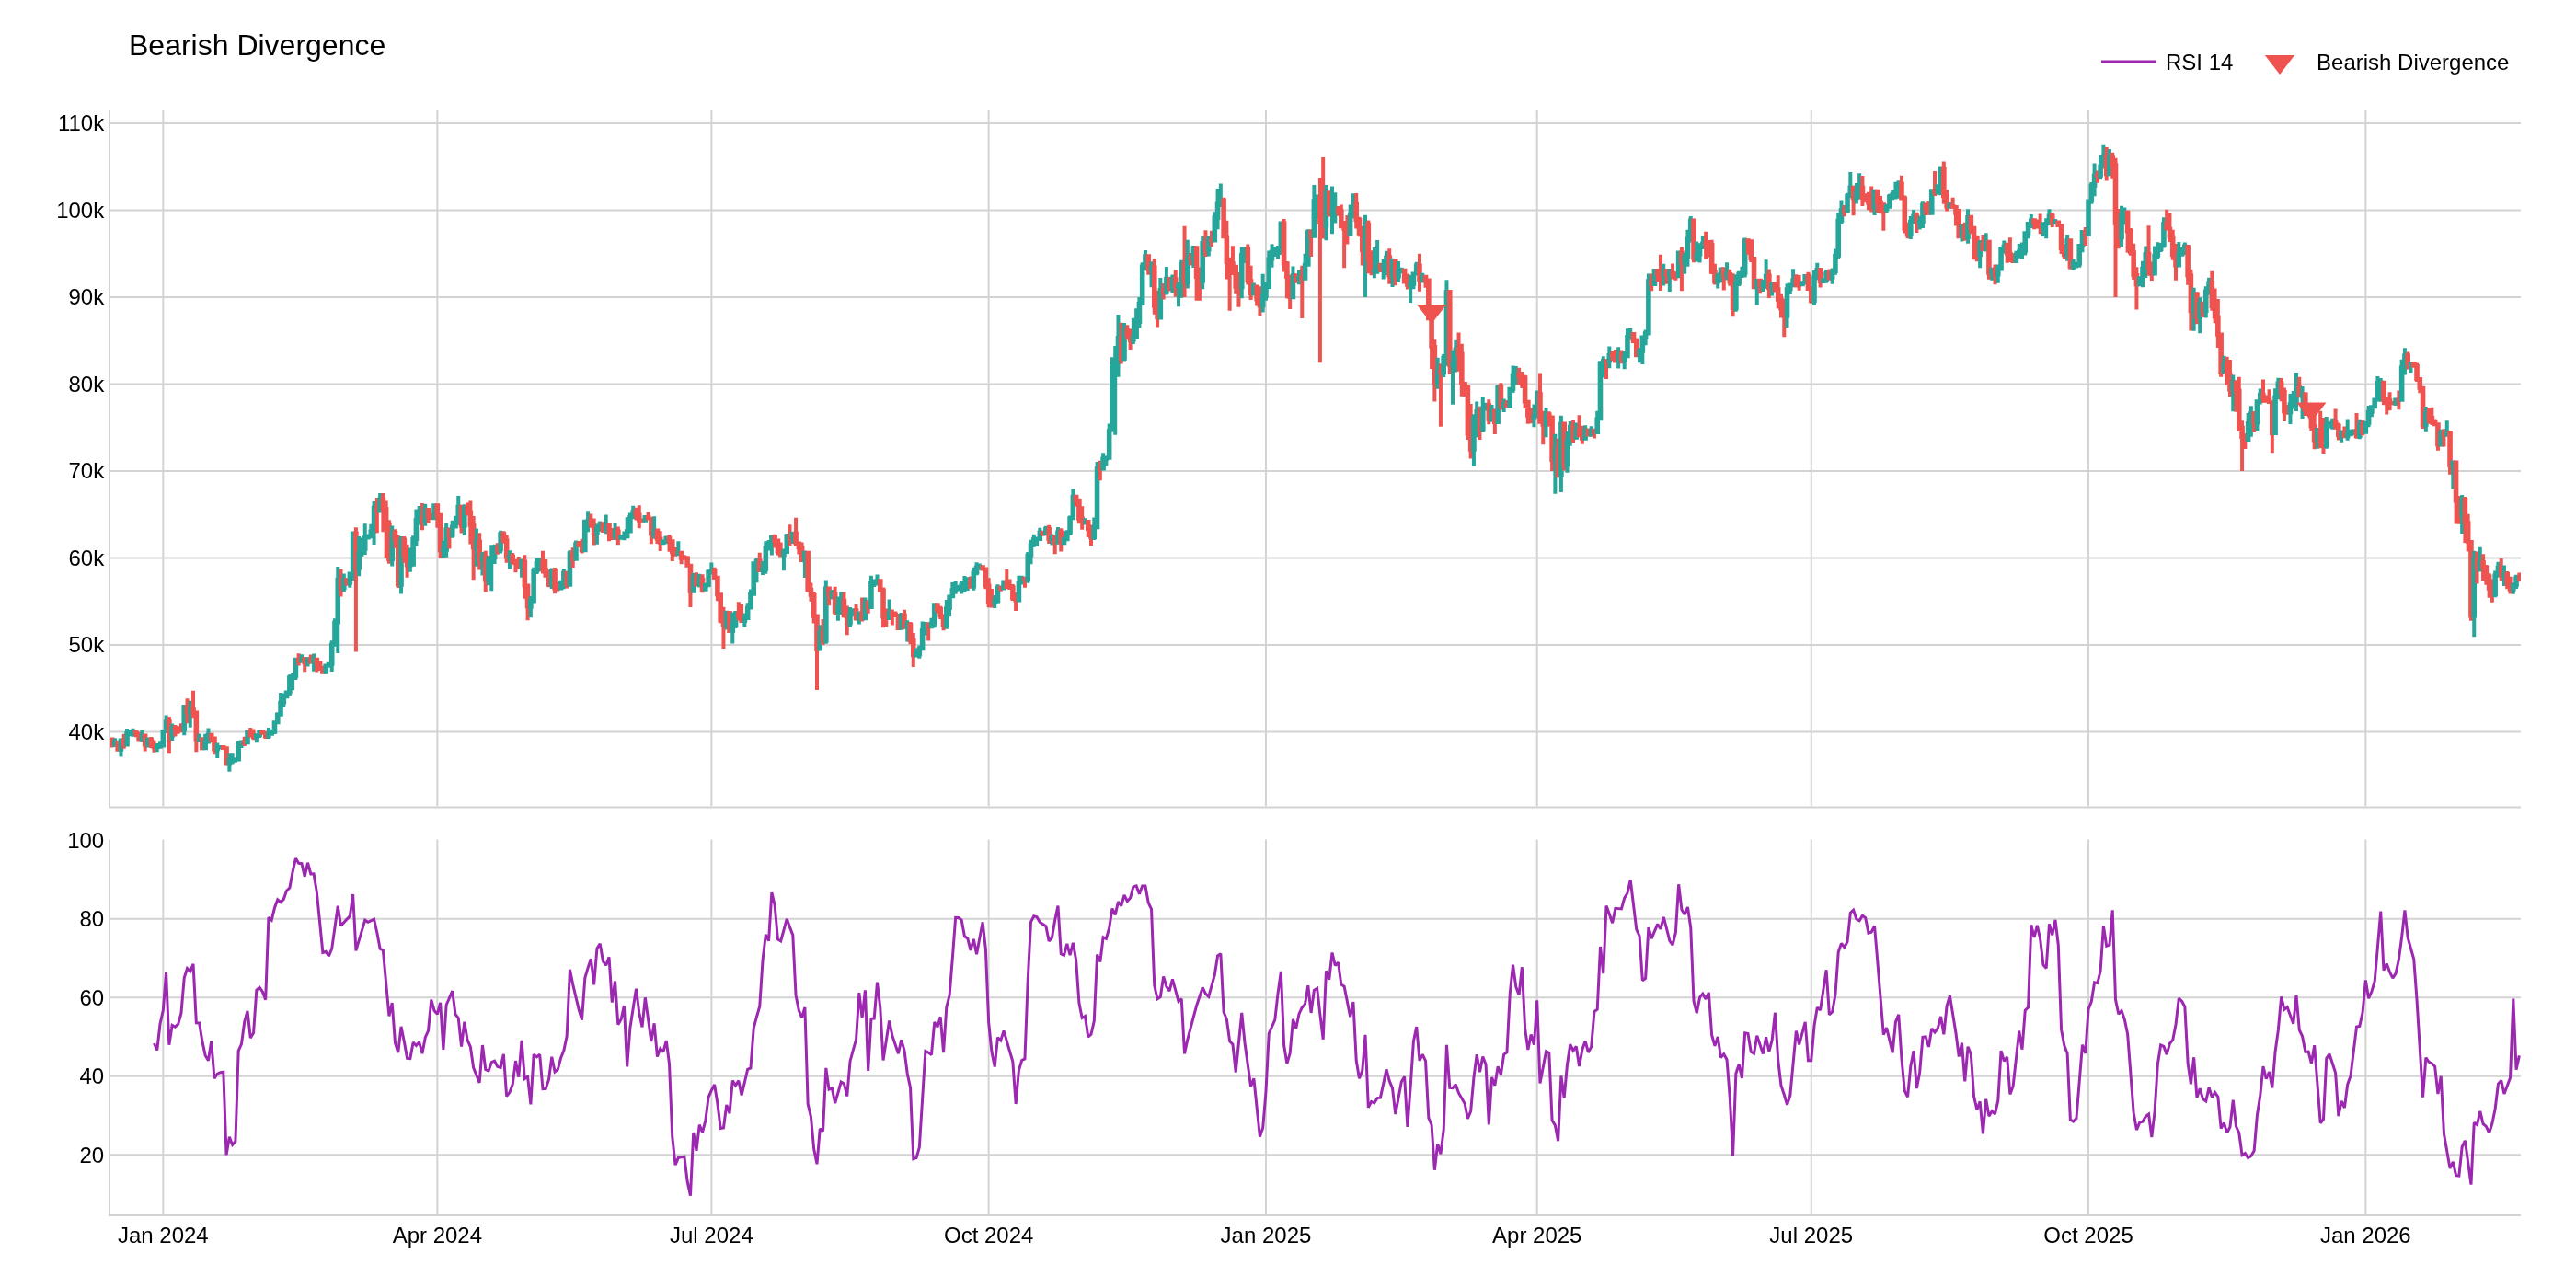
Detect Bearish Divergence
🟢 Real-time — ≈
number_of_neighbors_to_comparebars after the peakWarmup:
2 × number_of_neighbors_to_compare + 1bars (default: 11 bars (number_of_neighbors_to_compare=5))
Detects when price makes higher highs but an oscillator makes lower highs. Use it to spot potential tops in an uptrend.