Volume Weighted Trend (VWT)
Minimum bars needed: vwma_length bars
(default params: 34 bars (vwma_length=34))
The VWMA needs vwma_length bars of price and volume data. The ATR band also uses the same period. After warmup, the indicator updates in real-time.
✅ After the warmup window is filled, this indicator produces a new value on every incoming bar in real-time.
The VWMA center line and trend signals lag behind price reversals.
| Event | Lag | Detail |
|---|---|---|
| VWMA center line reacts to price reversal | ≈ vwma_length / 2 bars | VWMA has lag ≈ vwma_length/2 |
| Upper/lower bands react | ≈ vwma_length / 2 bars | Bands use ATR with same period as VWMA |
| Trend flips bullish ↔ bearish | ≈ vwma_length / 2 bars | Trend determined by close vs VWMA |
| Buy / sell signal fires | ≈ vwma_length / 2 bars | Signal fires on the bar the trend flips |
Formula for custom params: lag ≈ vwma_length / 2
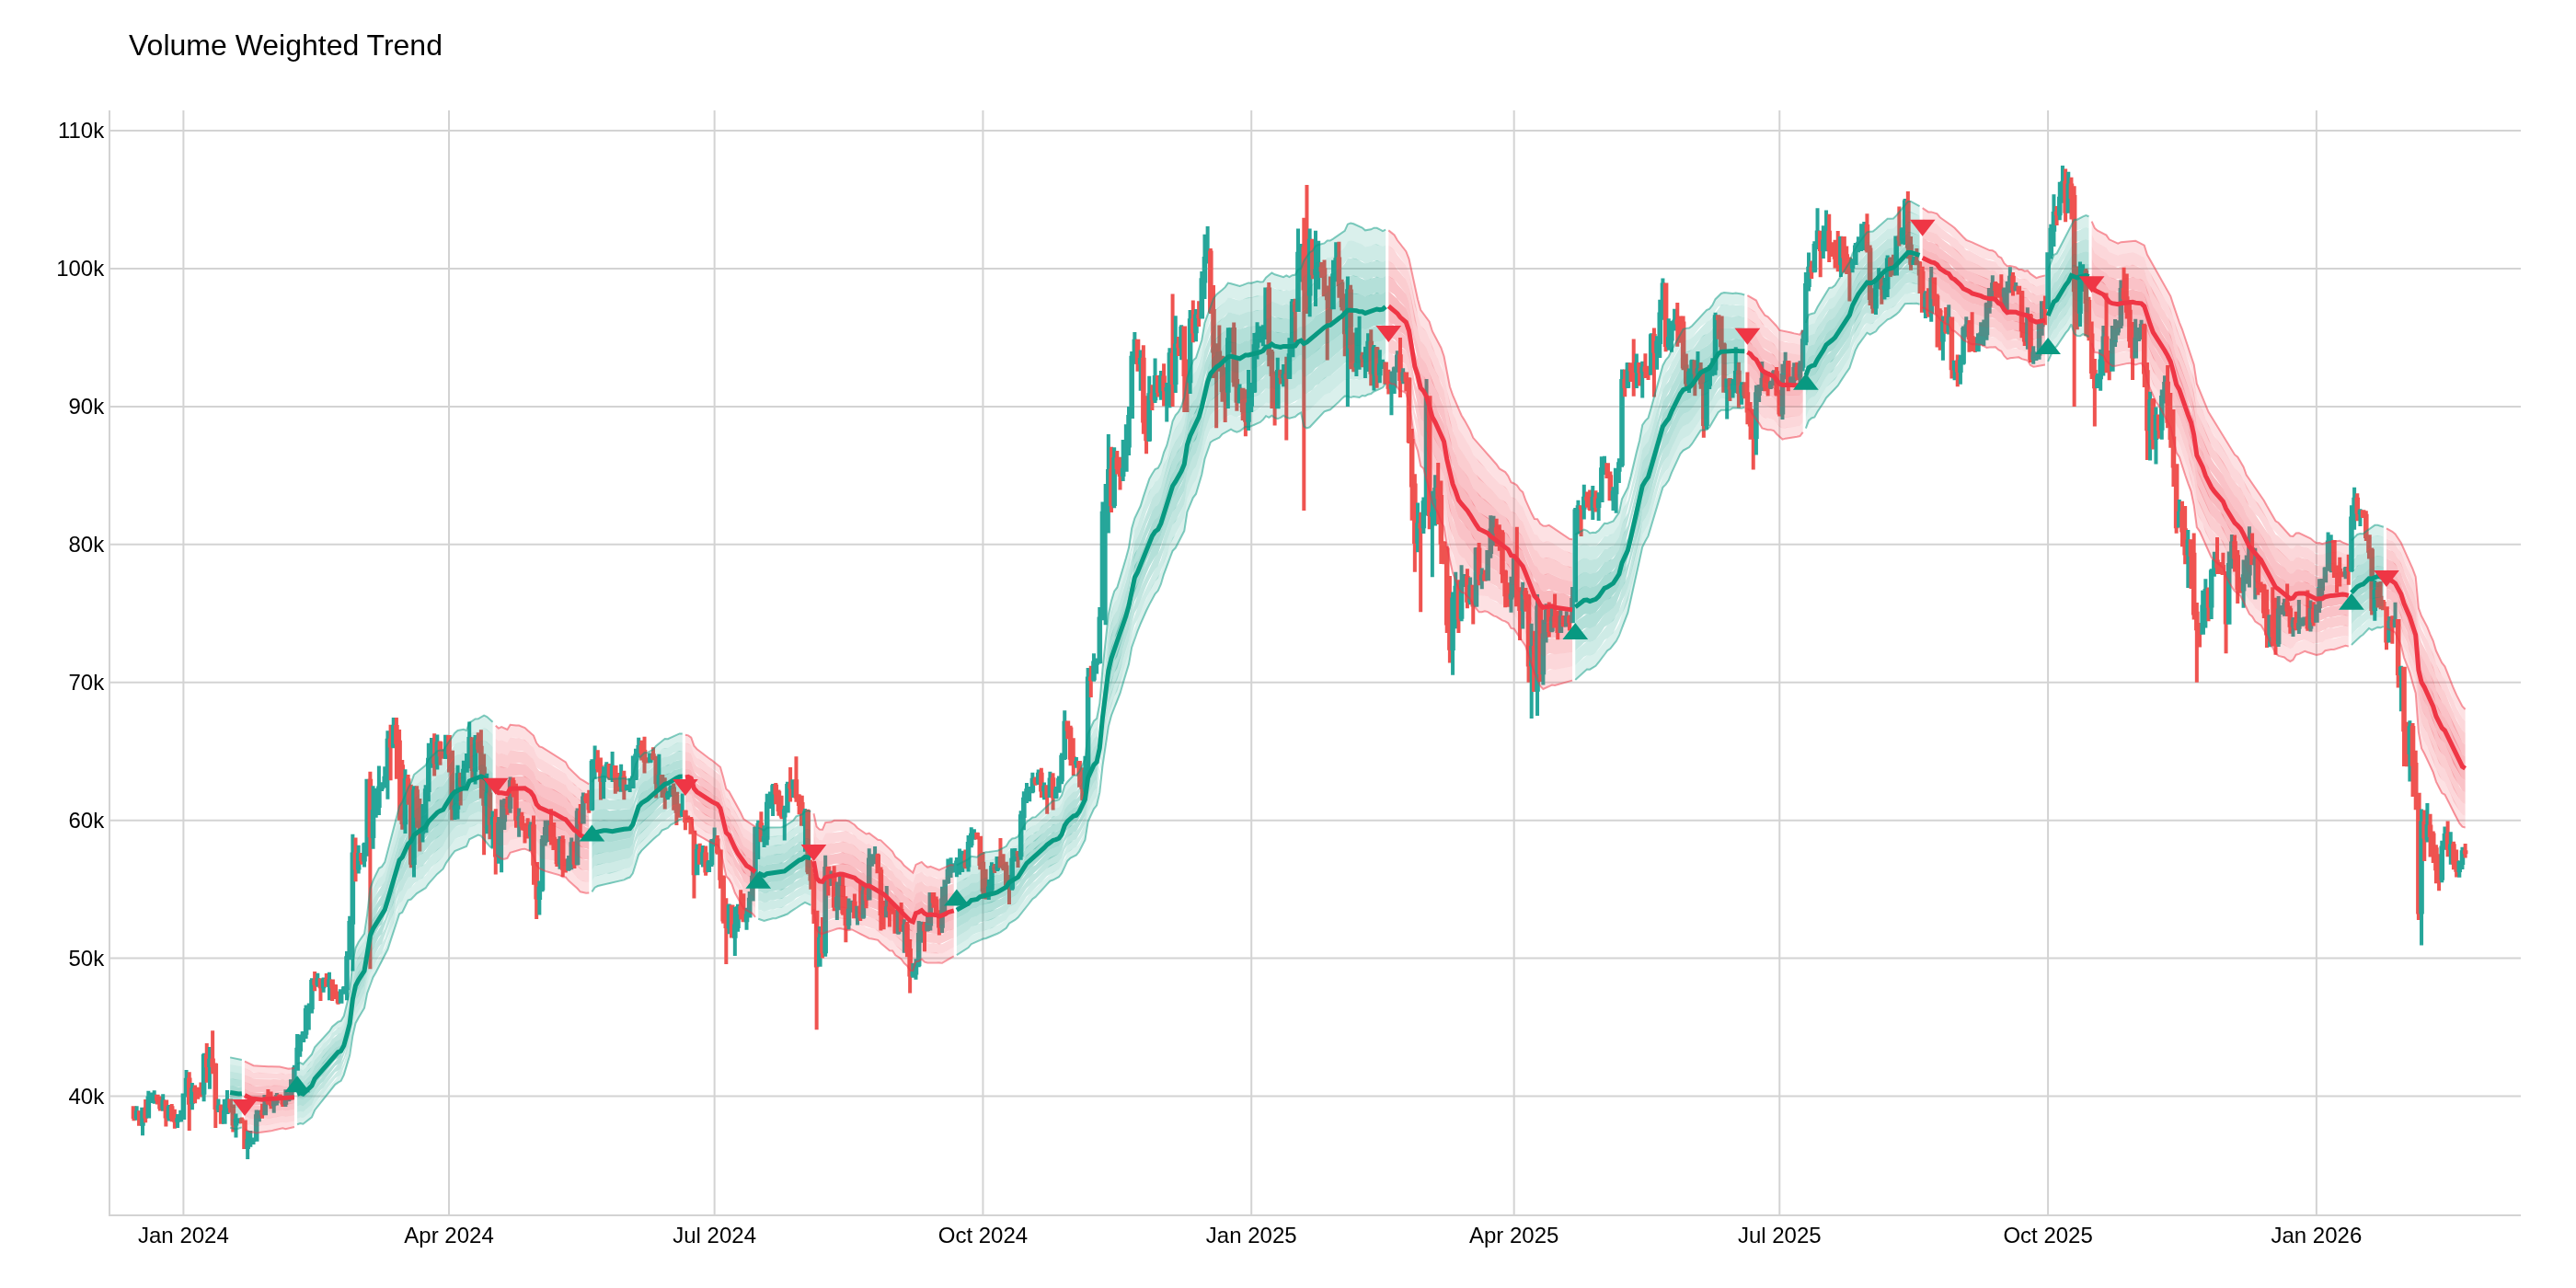
The Volume Weighted Trend indicator uses a Volume Weighted Moving Average (VWMA) with ATR-based volatility bands to determine trend direction. Based on the "Volume Weighted Trend [QuantAlgo]" concept. The VWMA serves as the trend baseline, while upper and lower bands (VWMA +/- ATR * multiplier) define breakout thresholds. The trend flips bullish when price closes above the upper band and bearish when price closes below the lower band.
def volume_weighted_trend(
    df: Union[PdDataFrame, PlDataFrame],
    vwma_length: int = 34,
    atr_multiplier: float = 1.5,
    high_column: str = "High",
    low_column: str = "Low",
    close_column: str = "Close",
    volume_column: str = "Volume",
) -> Union[PdDataFrame, PlDataFrame]:
Returns the following columns:
vwt_vwma: Volume Weighted Moving Averagevwt_atr: Average True Rangevwt_upper: Upper volatility band (VWMA + ATR * multiplier)vwt_lower: Lower volatility band (VWMA - ATR * multiplier)vwt_trend: Trend direction (+1 bullish, -1 bearish, 0 undefined)vwt_trend_changed: 1 on bars where trend flipped, 0 otherwisevwt_signal: +1 on bullish flip, -1 on bearish flip, 0 otherwise
Example
from investing_algorithm_framework import download

from pyindicators import volume_weighted_trend, get_volume_weighted_trend_stats

pd_df = download(
    symbol="btc/eur",
    market="bitvavo",
    time_frame="4h",
    start_date="2024-01-01",
    end_date="2024-04-01",
    pandas=True,
)

# Calculate Volume Weighted Trend
pd_df = volume_weighted_trend(pd_df, vwma_length=34, atr_multiplier=1.5)

# Get summary statistics
stats = get_volume_weighted_trend_stats(pd_df)
print(stats)

pd_df[["Close", "vwt_vwma", "vwt_upper", "vwt_lower", "vwt_trend", "vwt_signal"]].tail(10)
Momentum and Oscillators
Indicators that measure the strength and speed of price movements rather than the direction.
The image above uses the following parameters:
| Parameter | Value |
|---|---|
vwma_length | 34 |
atr_multiplier | 1.5 |