SuperTrend Clustering
Minimum bars needed: atr_length bars
(default params: 14 bars (atr_length=14))
Same as SuperTrend — the ATR component needs atr_length bars. The K-means clustering runs over the full dataset but does not add to the warmup requirement. After warmup, the indicator updates in real-time.
✅ After the warmup window is filled, this indicator produces a new value on every incoming bar in real-time.
Same lag as SuperTrend; K-means selects the optimal factor but does not change the lag.
| Event | Lag | Detail |
|---|---|---|
| Trend flips bullish ↔ bearish | ≈ atr_length / 2 bars | ATR smoothing creates the lag |
| Buy / sell signal fires | ≈ atr_length / 2 bars | Signal fires on the bar the trend flips |
Formula for custom params: lag ≈ atr_length / 2
The SuperTrend Clustering indicator uses K-means clustering to optimize the ATR multiplier factor for the SuperTrend calculation. It computes multiple SuperTrend variations with different factors, evaluates their performance, and clusters them into "best", "average", and "worst" groups. The best-performing factor is then used to generate an adaptive trailing stop with buy/sell signals.
def supertrend_clustering(
    data: Union[PdDataFrame, PlDataFrame],
    atr_length: int = 10,
    min_mult: float = 1.0,
    max_mult: float = 5.0,
    step: float = 0.5,
    perf_alpha: float = 10.0,
    from_cluster: str = 'best',
    max_iter: int = 1000,
    max_data: int = 10000
) -> Union[PdDataFrame, PlDataFrame]:
Returns the following columns:
supertrend: The optimized SuperTrend trailing stopsupertrend_trend: Current trend (1=bullish, 0=bearish)supertrend_ama: Adaptive moving average of SuperTrendsupertrend_perf_idx: Performance index (0–1 scale)supertrend_factor: Currently used ATR factorsupertrend_signal: 1=buy signal, -1=sell signal, 0=no signal
Example
from investing_algorithm_framework import download

from pyindicators import supertrend_clustering, get_supertrend_stats

pd_df = download(
    symbol="btc/eur",
    market="binance",
    time_frame="1d",
    start_date="2023-12-01",
    end_date="2023-12-25",
    pandas=True,
    save=True,
    storage_path="./data"
)

# Calculate SuperTrend Clustering
pd_df = supertrend_clustering(
    pd_df,
    atr_length=14,
    min_mult=2.0,
    max_mult=6.0,
    step=0.5,
    perf_alpha=14.0,
    from_cluster='best',
    max_data=500
)

# Get statistics
stats = get_supertrend_stats(pd_df)
print(stats)
pd_df.tail(10)
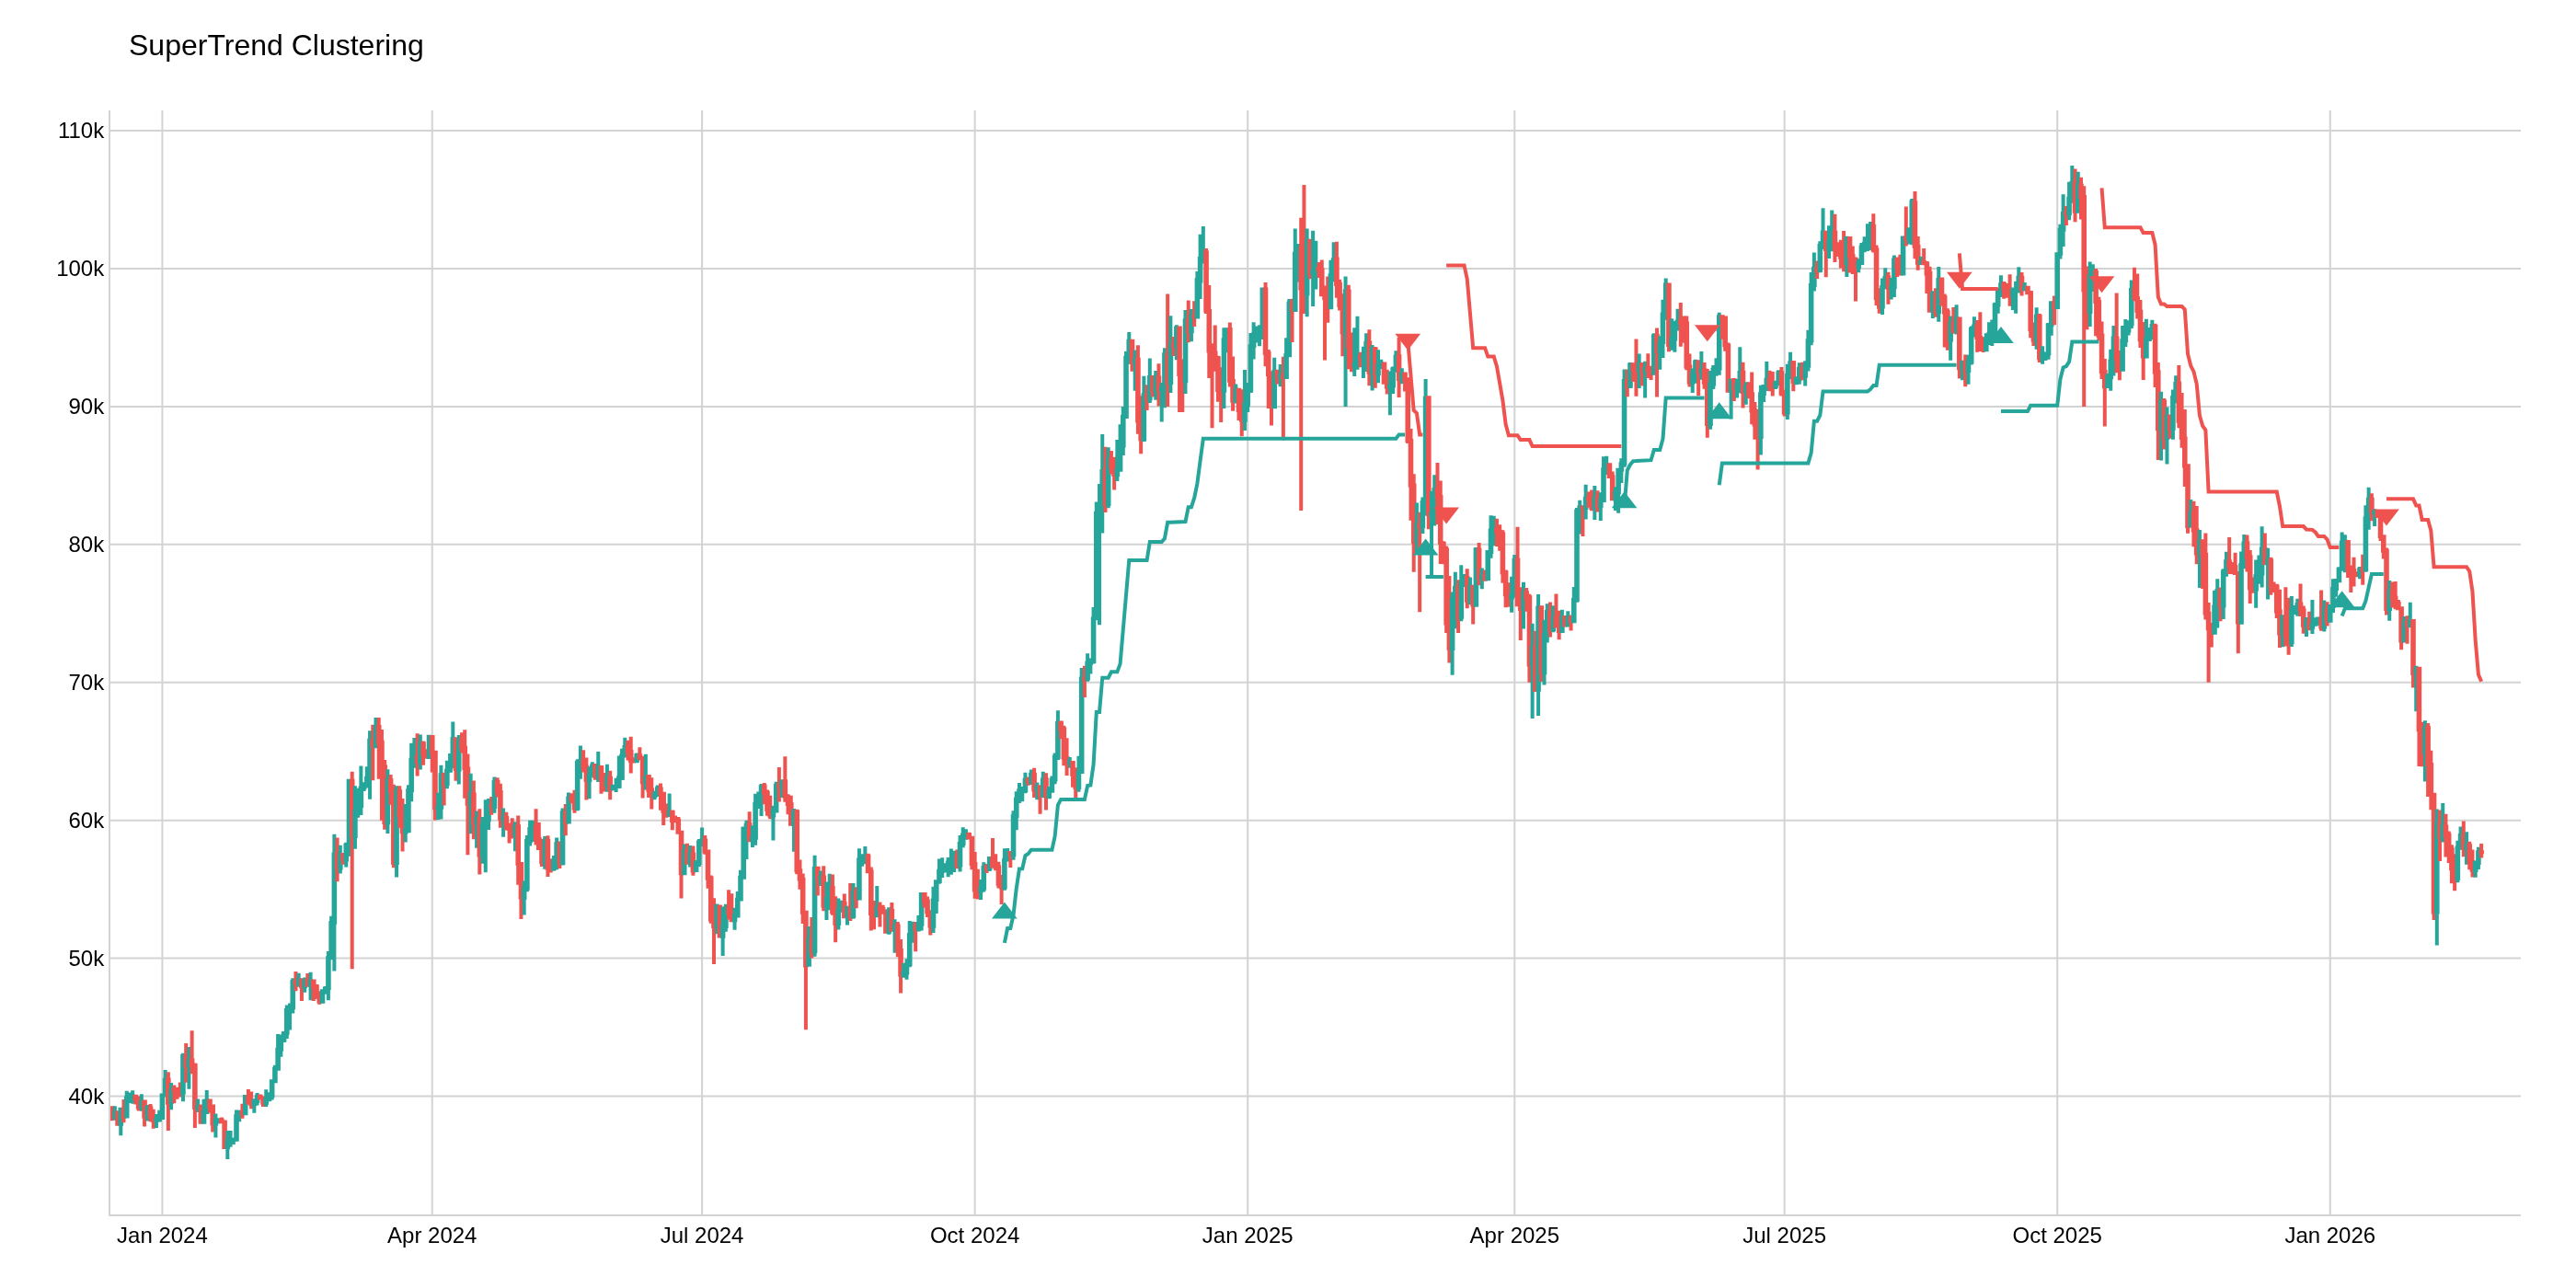
The image above uses the following parameters:
| Parameter | Value |
|---|---|
atr_length | 14 |
min_mult | 2.0 |
max_mult | 6.0 |
step | 0.5 |
perf_alpha | 14.0 |
from_cluster | best |
max_data | 500 |