Simple Moving Average (SMA)
Warmup Window
Minimum bars needed: period bars
(default params: 200 bars (period=200))
The first valid SMA value appears once period bars of close data are available. After the warmup, the indicator updates in real-time on every new bar.
✅ After the warmup window is filled, this indicator produces a new value on every incoming bar in real-time.
Lagging Indicator
The SMA line moves with a delay behind price.
| Event | Lag | Detail |
|---|---|---|
| Line reacts to a price reversal | ≈ (period − 1) / 2 bars | Uniform rolling window; center of gravity sits at the midpoint of the window |
| Line crosses price (trend confirmation) | ≈ (period − 1) / 2 bars | Crossover inherits the same smoothing delay |
Formula for custom params: lag ≈ (period − 1) / 2
A Simple Moving Average (SMA) is the average of the last N data points, recalculated as new data comes in. Unlike the Weighted Moving Average (WMA), SMA treats all values equally, giving them the same weight.
def sma(
    data: Union[PdDataFrame, PlDataFrame],
    source_column: str,
    period: int,
    result_column: str = None,
) -> Union[PdDataFrame, PlDataFrame]:
Example
from investing_algorithm_framework import download

from pyindicators import sma

pl_df = download(
    symbol="btc/eur",
    market="binance",
    time_frame="1d",
    start_date="2023-12-01",
    end_date="2023-12-25",
    save=True,
    storage_path="./data"
)
pd_df = download(
    symbol="btc/eur",
    market="binance",
    time_frame="1d",
    start_date="2023-12-01",
    end_date="2023-12-25",
    pandas=True,
    save=True,
    storage_path="./data"
)

# Calculate SMA for Polars DataFrame
pl_df = sma(pl_df, source_column="Close", period=200, result_column="SMA_200")
pl_df.show(10)

# Calculate SMA for Pandas DataFrame
pd_df = sma(pd_df, source_column="Close", period=200, result_column="SMA_200")
pd_df.tail(10)
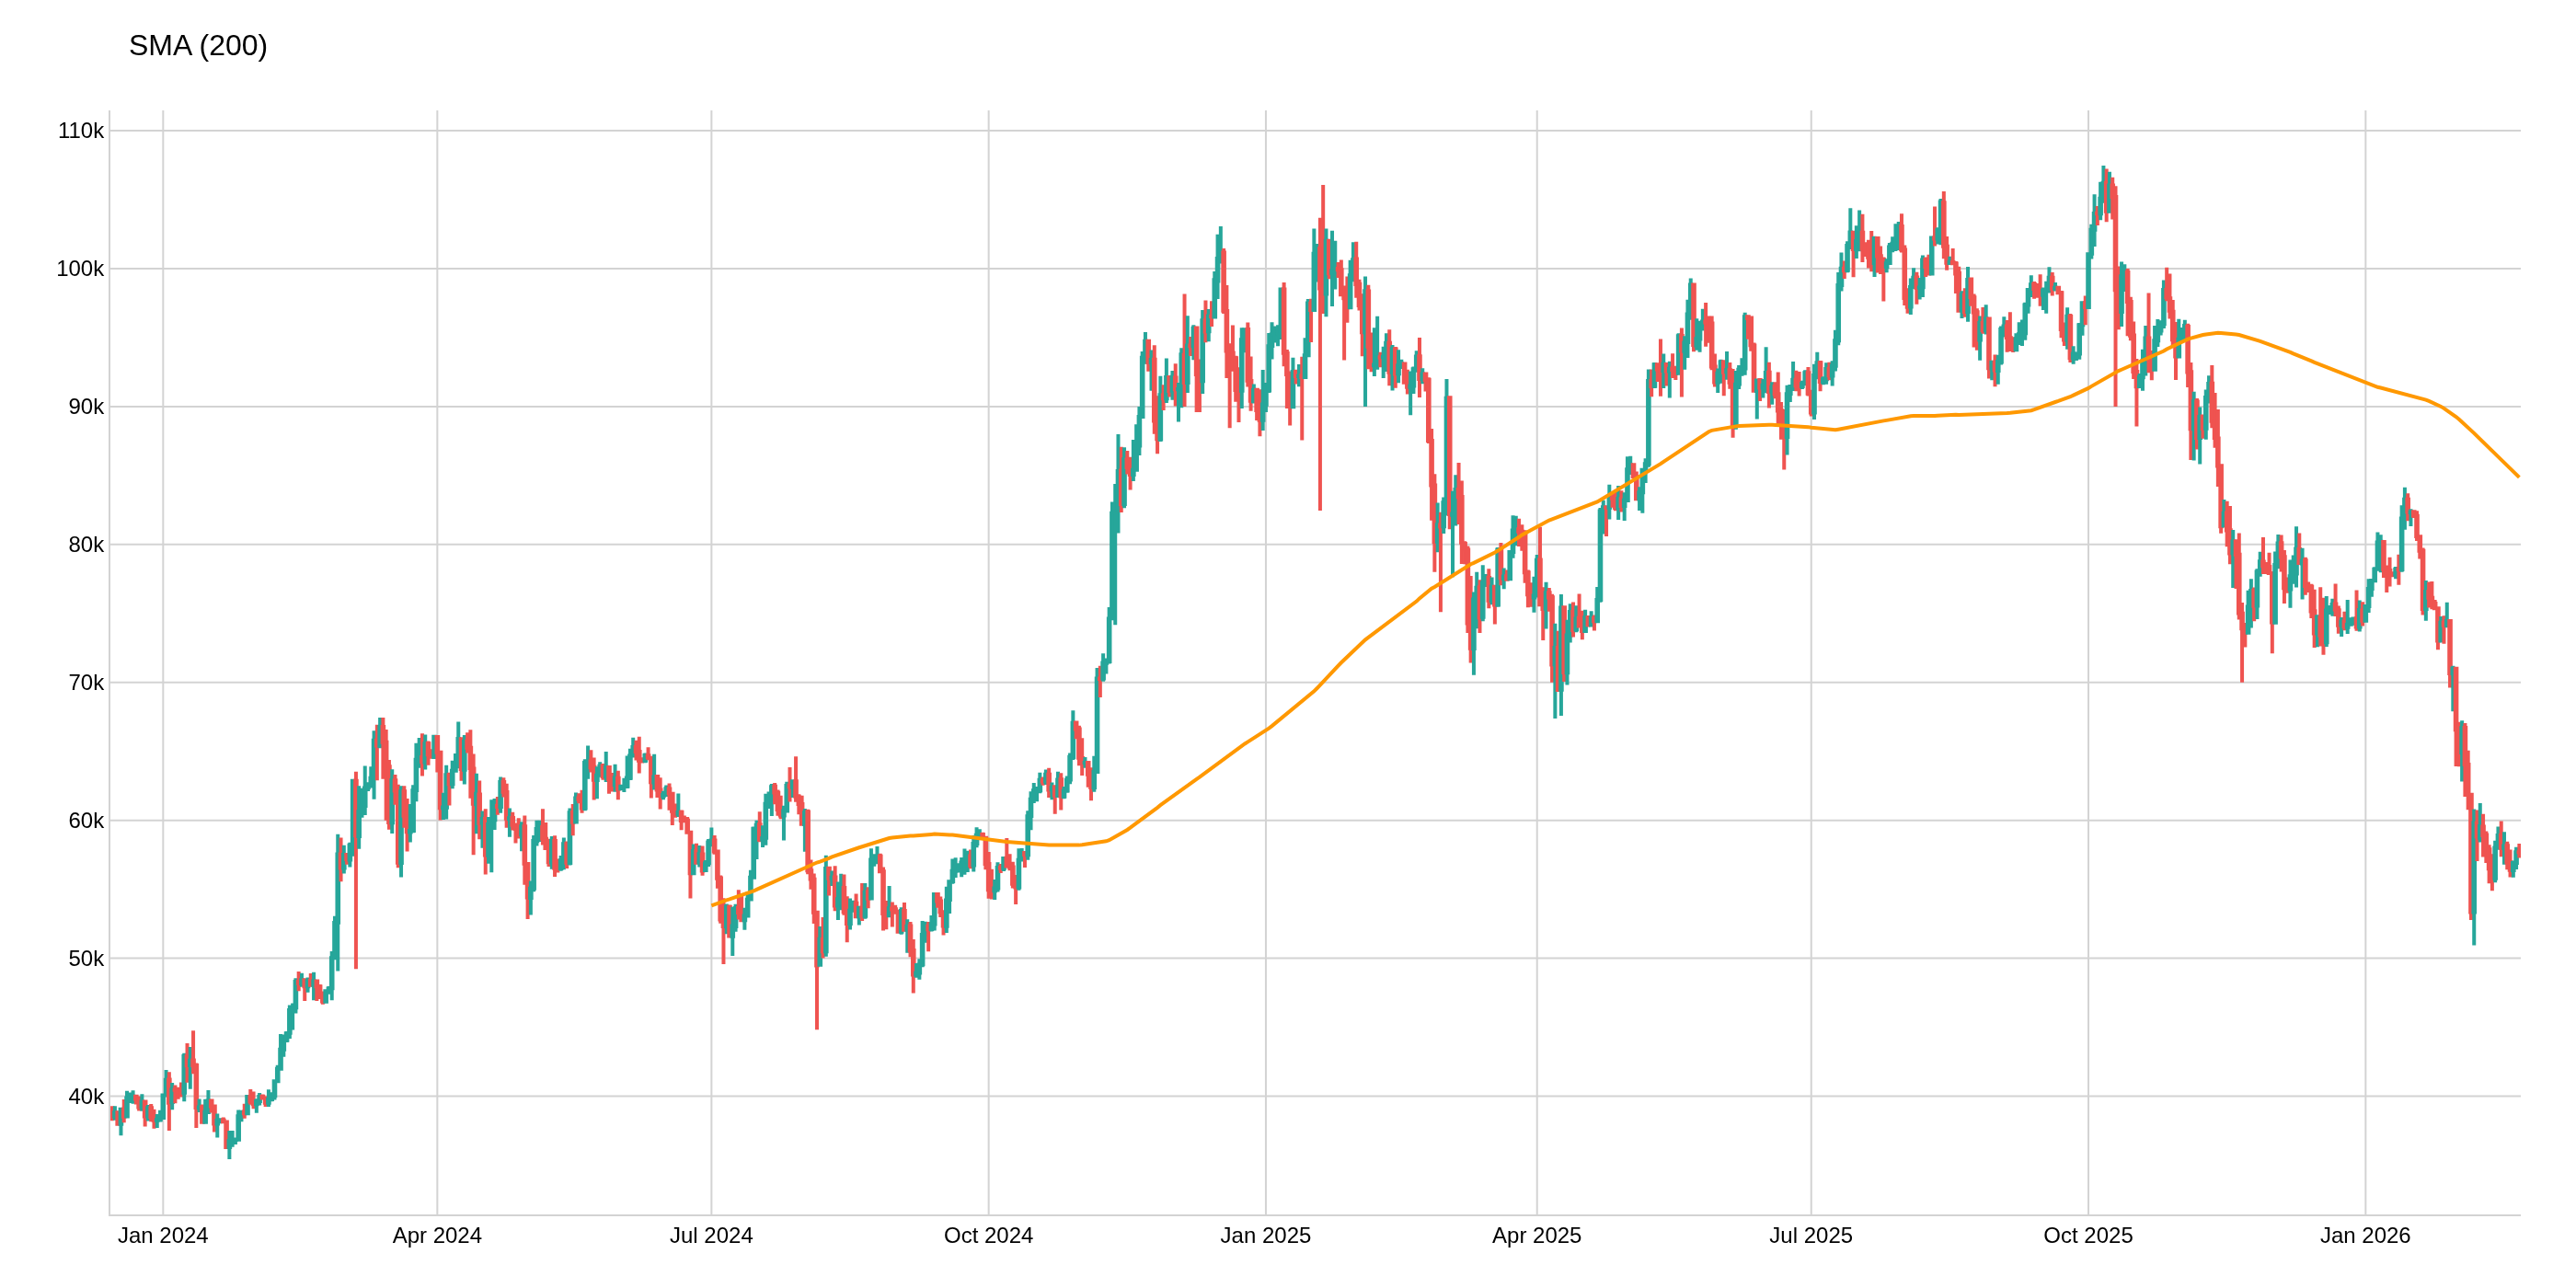
Chart Parameters
The image above uses the following parameters:
| Parameter | Value |
|---|---|
source_column | Close |
period | 200 |