Crossunder
Minimum bars needed: 2 bars (default params: 2 bars)
Compares current bar vs previous bar. No rolling window — works from bar 2 onward.
✅ After the warmup window is filled, this indicator produces a new value on every incoming bar in real-time.
Crossunder detection is instant — no additional smoothing is applied.
| Event | Lag | Detail |
|---|---|---|
| Crossunder detected | 0 bars | Compares current vs previous bar values |
The crossunder function is used to calculate the crossunder between two columns in a DataFrame. It returns a new DataFrame with an additional column that contains the crossunder values. A crossunder occurs when the first column crosses below the second column. This can happen in two ways, a strict crossunder or a non-strict crossunder. In a strict crossunder, the first column must cross below the second column. In a non-strict crossunder, the first column must cross below the second column, but the values can be equal.
def crossunder(
    data: Union[PdDataFrame, PlDataFrame],
    first_column: str,
    second_column: str,
    result_column="crossunder",
    number_of_data_points: int = None,
    strict: bool = True,
) -> Union[PdDataFrame, PlDataFrame]:
Example
from investing_algorithm_framework import download
from pyindicators import crossunder, ema

pl_df = download(
    symbol="btc/eur",
    market="binance",
    time_frame="1d",
    start_date="2023-12-01",
    end_date="2023-12-25",
    save=True,
    storage_path="./data"
)
pd_df = download(
    symbol="btc/eur",
    market="binance",
    time_frame="1d",
    start_date="2023-12-01",
    end_date="2023-12-25",
    pandas=True,
    save=True,
    storage_path="./data"
)

# Calculate EMA and crossunder for Polars DataFrame
pl_df = ema(pl_df, source_column="Close", period=200, result_column="EMA_200")
pl_df = ema(pl_df, source_column="Close", period=50, result_column="EMA_50")
pl_df = crossunder(
    pl_df,
    first_column="EMA_50",
    second_column="EMA_200",
    result_column="Crossunder_EMA"
)
pl_df.show(10)

# Calculate EMA and crossunder for Pandas DataFrame
pd_df = ema(pd_df, source_column="Close", period=200, result_column="EMA_200")
pd_df = ema(pd_df, source_column="Close", period=50, result_column="EMA_50")
pd_df = crossunder(
    pd_df,
    first_column="EMA_50",
    second_column="EMA_200",
    result_column="Crossunder_EMA"
)
pd_df.tail(10)
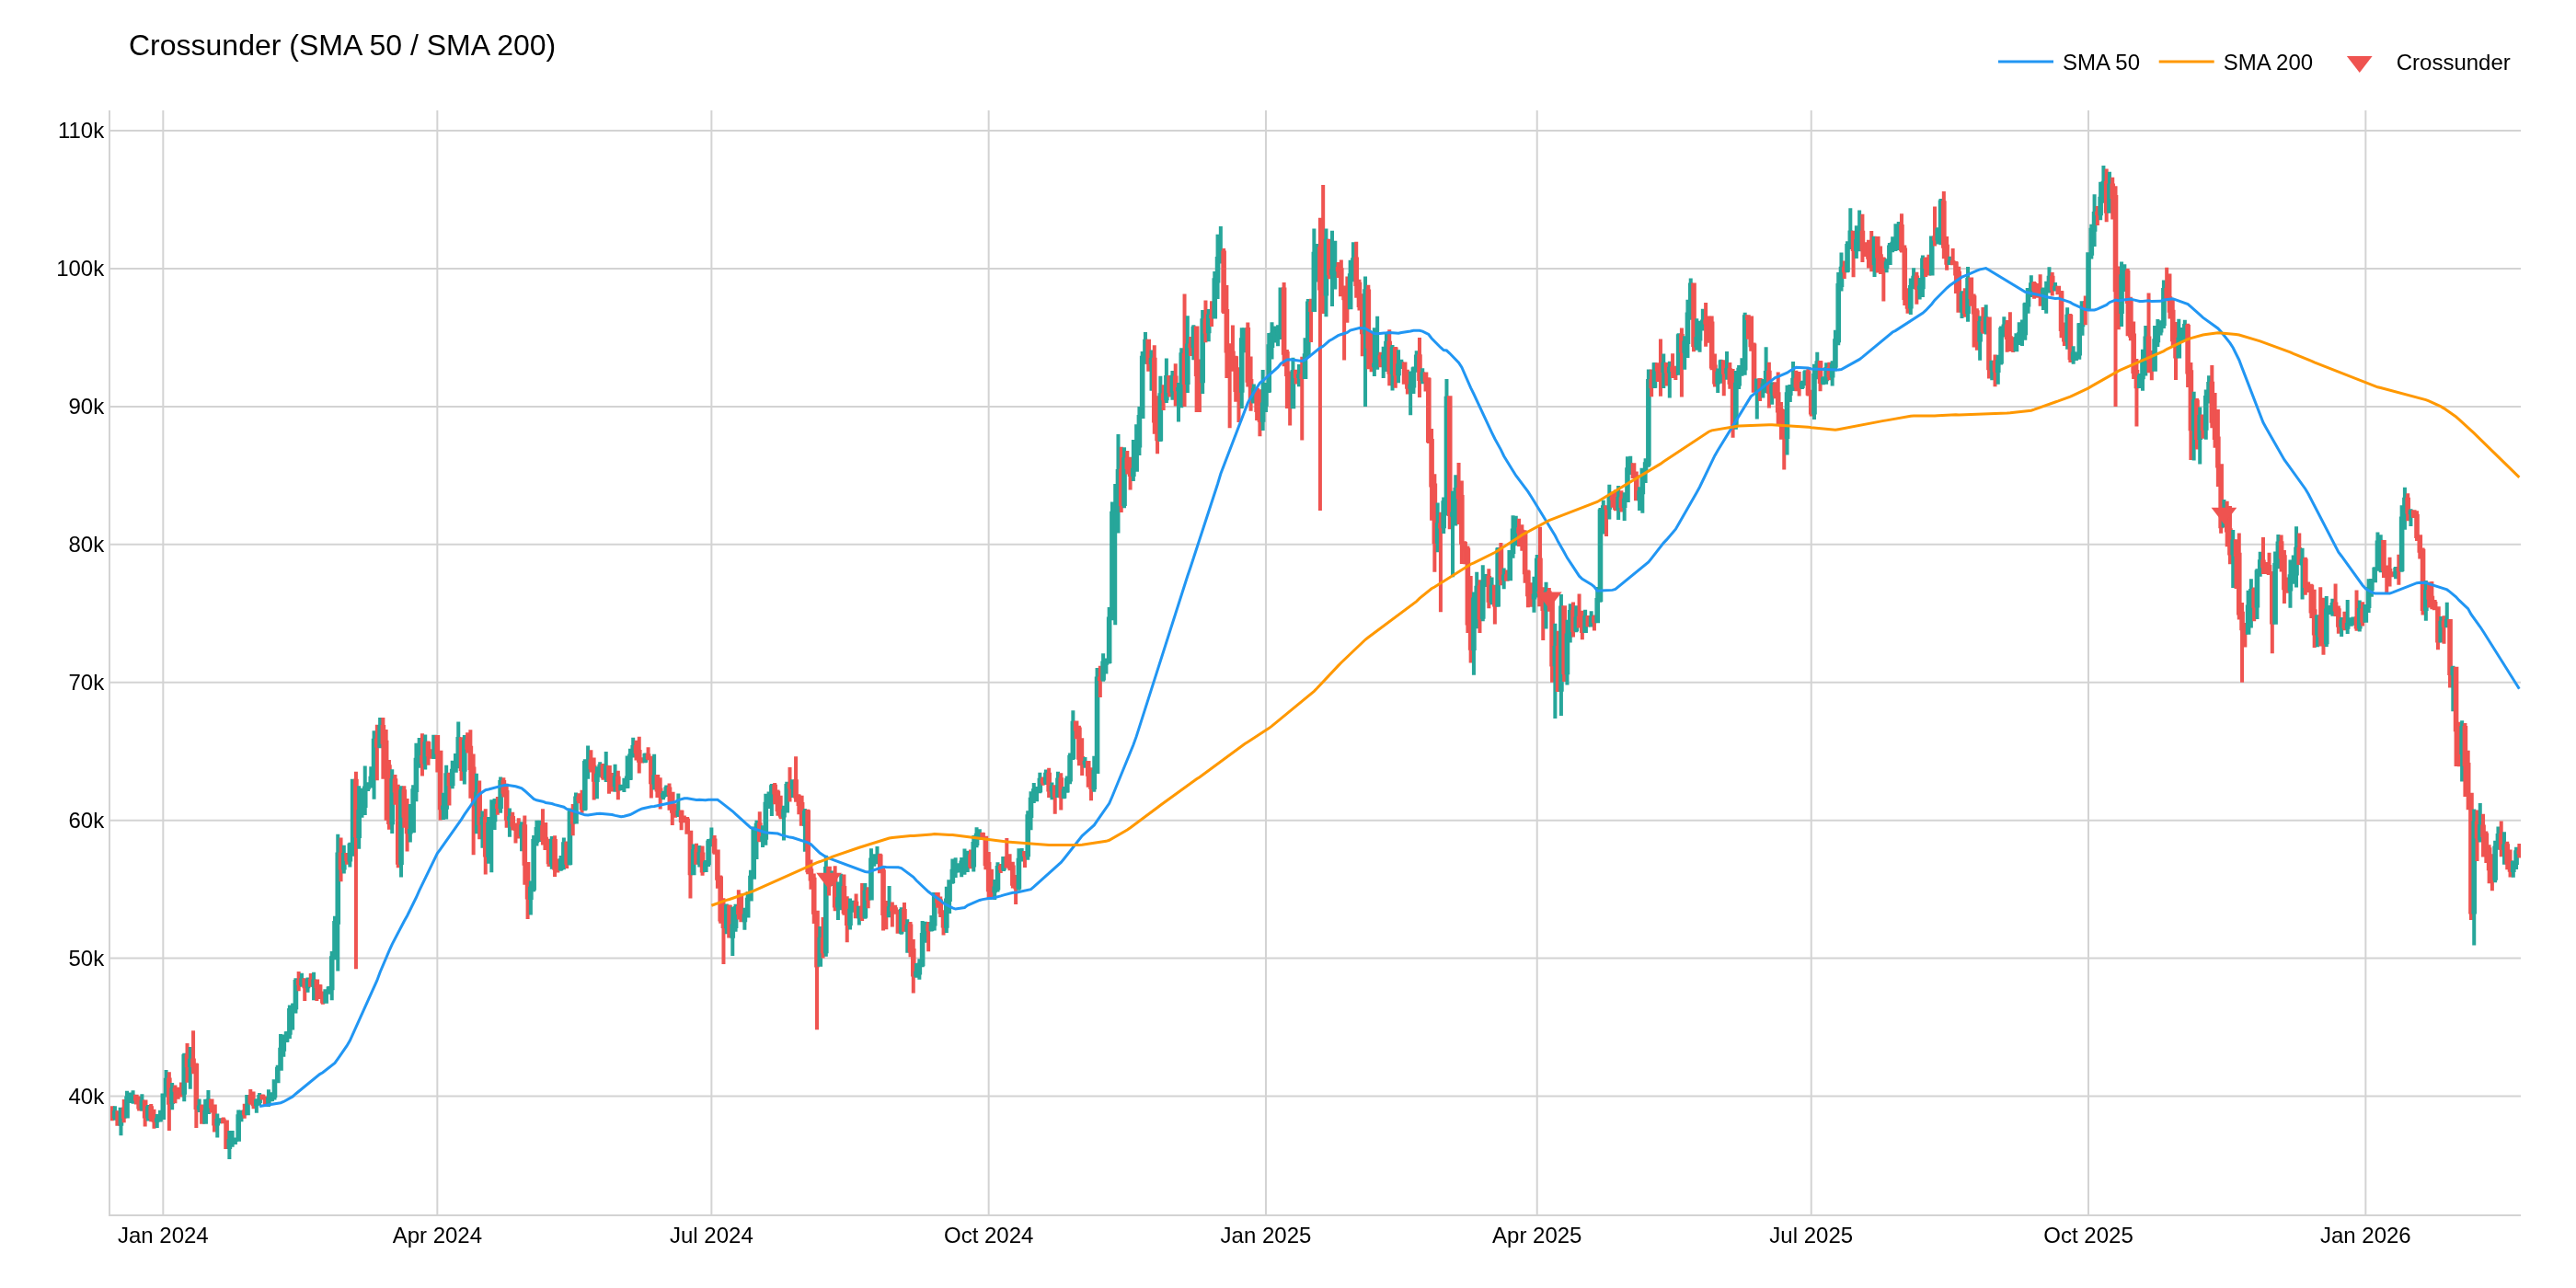
The image above uses the following parameters:
| Parameter | Value |
|---|---|
first_column | SMA_50 |
second_column | SMA_200 |