has_any_lower_then_threshold
Minimum bars needed: 1 bar (default params: 1 bar)
Direct comparison of values vs threshold. No rolling window needed.
✅ After the warmup window is filled, this indicator produces a new value on every incoming bar in real-time.
Simple value comparison — no smoothing.
| Event | Lag | Detail |
|---|---|---|
| Threshold condition detected | 0 bars | Direct comparison of recent values vs threshold |
The has_any_lower_then_threshold function checks if any value in a given column is lower than a specified threshold within the last N data points. This is useful for detecting when an indicator or price falls below a critical level.
def has_any_lower_then_threshold(
    data: Union[pd.DataFrame, pl.DataFrame],
    column,
    threshold,
    strict=True,
    number_of_data_points=1
) -> bool:
    ...
Example
import pandas as pd
from pyindicators.indicators.utils import has_any_lower_then_threshold

# Example DataFrame
prices = pd.DataFrame({
    'Close': [100, 98, 97, 99, 96, 95, 97, 98, 99, 100]
})

# Check if any of the last 5 closes are below 97
result = has_any_lower_then_threshold(prices, column='Close', threshold=97, number_of_data_points=5)
print(result)  # Output: True
Below is a chart showing the threshold and the points where the condition is met:
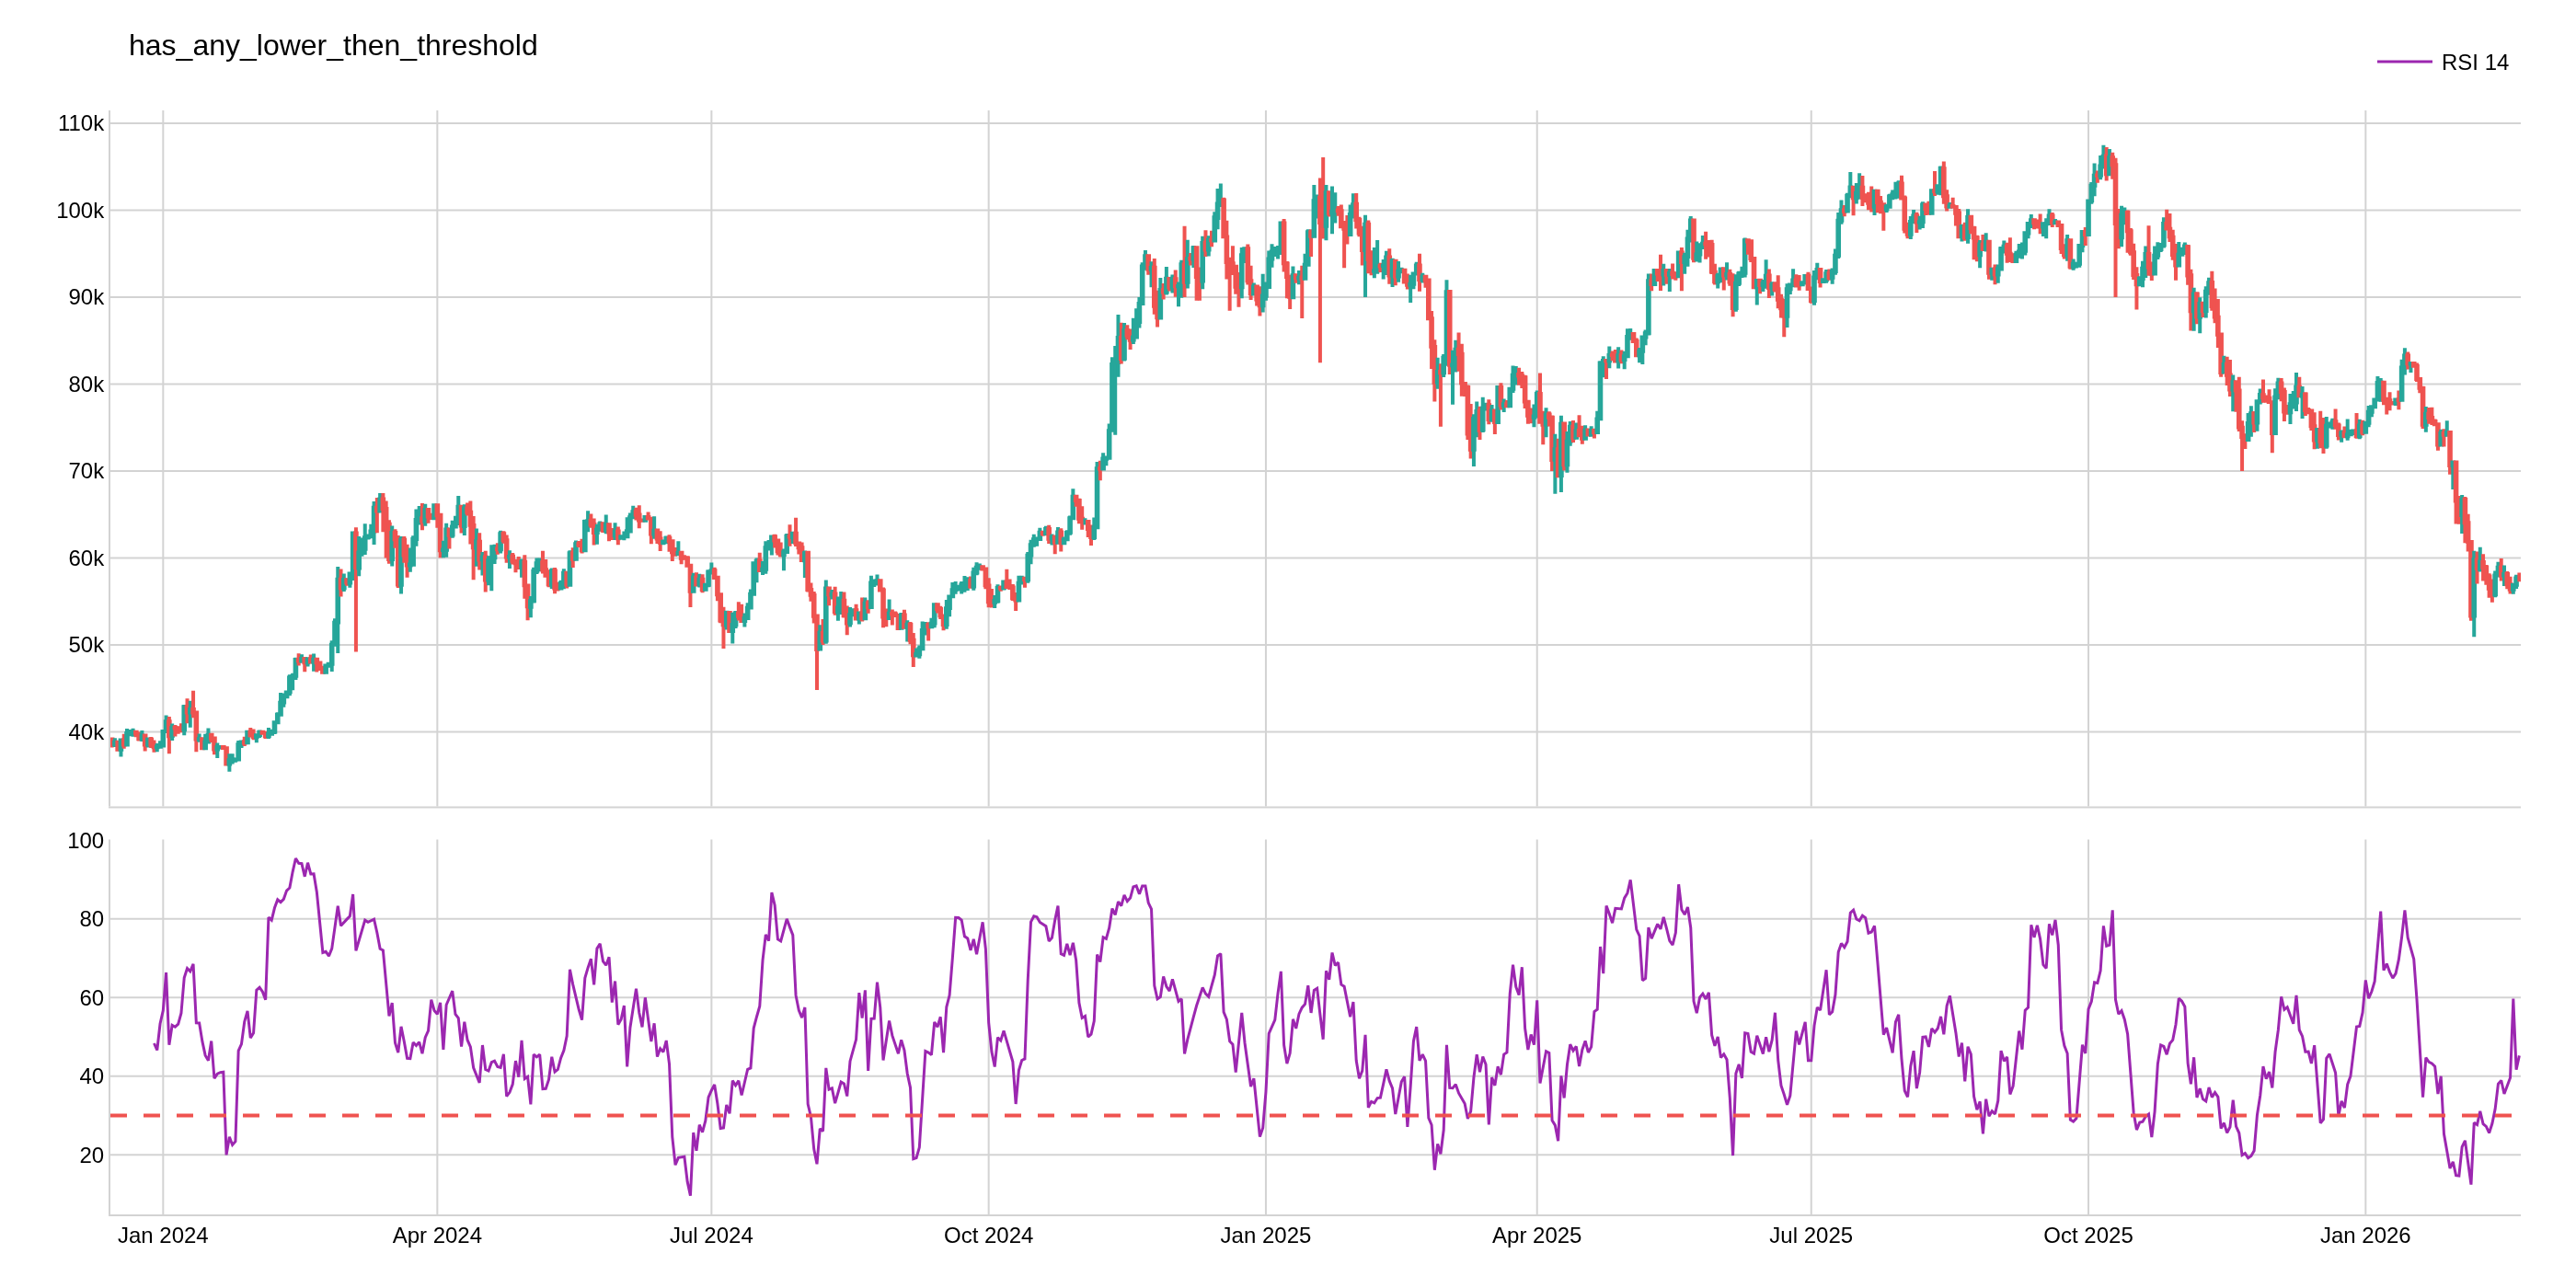
In this chart, the red line represents the threshold, and the highlighted points are where the Close value is below the threshold in the last N data points.
The image above uses the following parameters:
| Parameter | Value |
|---|---|
source_column | RSI_14 |
threshold | 30 |