Detect Bearish Divergence
Minimum bars needed: 2 × number_of_neighbors_to_compare + 1 bars
(default params: 11 bars (number_of_neighbors_to_compare=5))
Requires confirmed peaks in both price and indicator, inheriting the peak detection warmup. After warmup, divergences are detected in real-time.
✅ After the warmup window is filled, this indicator produces a new value on every incoming bar in real-time.
Divergence signals fire after peak confirmation.
| Event | Lag | Detail |
|---|---|---|
| Bearish divergence signal fires | ≈ number_of_neighbors_to_compare bars after the peak | Requires confirmed peaks in both price and indicator; inherits peak detection delay |
The detect_bearish_divergence function is used to identify bearish divergences between two columns in a DataFrame. It checks for bearish divergences based on the peaks and lows detected in the specified columns. The function returns a DataFrame with additional columns indicating the presence of bearish divergences.
A bearish divergence occurs when the price makes a higher high while the indicator makes a lower high. This suggests that the upward momentum is weakening, and a potential reversal to the downside may occur.
def bearish_divergence(
    data: Union[pd.DataFrame, pl.DataFrame],
    first_column: str,
    second_column: str,
    window_size=1,
    result_column: str = "bearish_divergence",
    number_of_neighbors_to_compare: int = 5,
    min_consecutive: int = 2
) -> Union[pd.DataFrame, pl.DataFrame]:
Example
from investing_algorithm_framework import download
from pyindicators import bearish_divergence
pl_df = download(
    symbol="btc/eur",
    market="binance",
    time_frame="1d",
    start_date="2023-12-01",
    end_date="2023-12-25",
    save=True,
    storage_path="./data"
)
pd_df = download(
    symbol="btc/eur",
    market="binance",
    time_frame="1d",
    start_date="2023-12-01",
    end_date="2023-12-25",
    pandas=True,
    save=True,
    storage_path="./data"
)

# Calculate bearish divergence for Polars DataFrame, treat first_column always as the indicator column
pl_df = bearish_divergence(pl_df, first_column="RSI_14", second_column="Close", window_size=8)
pl_df.show(10)

# Calculate bearish divergence for Pandas DataFrame, treat first_column always as the indicator column
pd_df = bearish_divergence(pd_df, first_column="RSI_14", second_column="Close", window_size=8)
pd_df.tail(10)
Indicator helpers
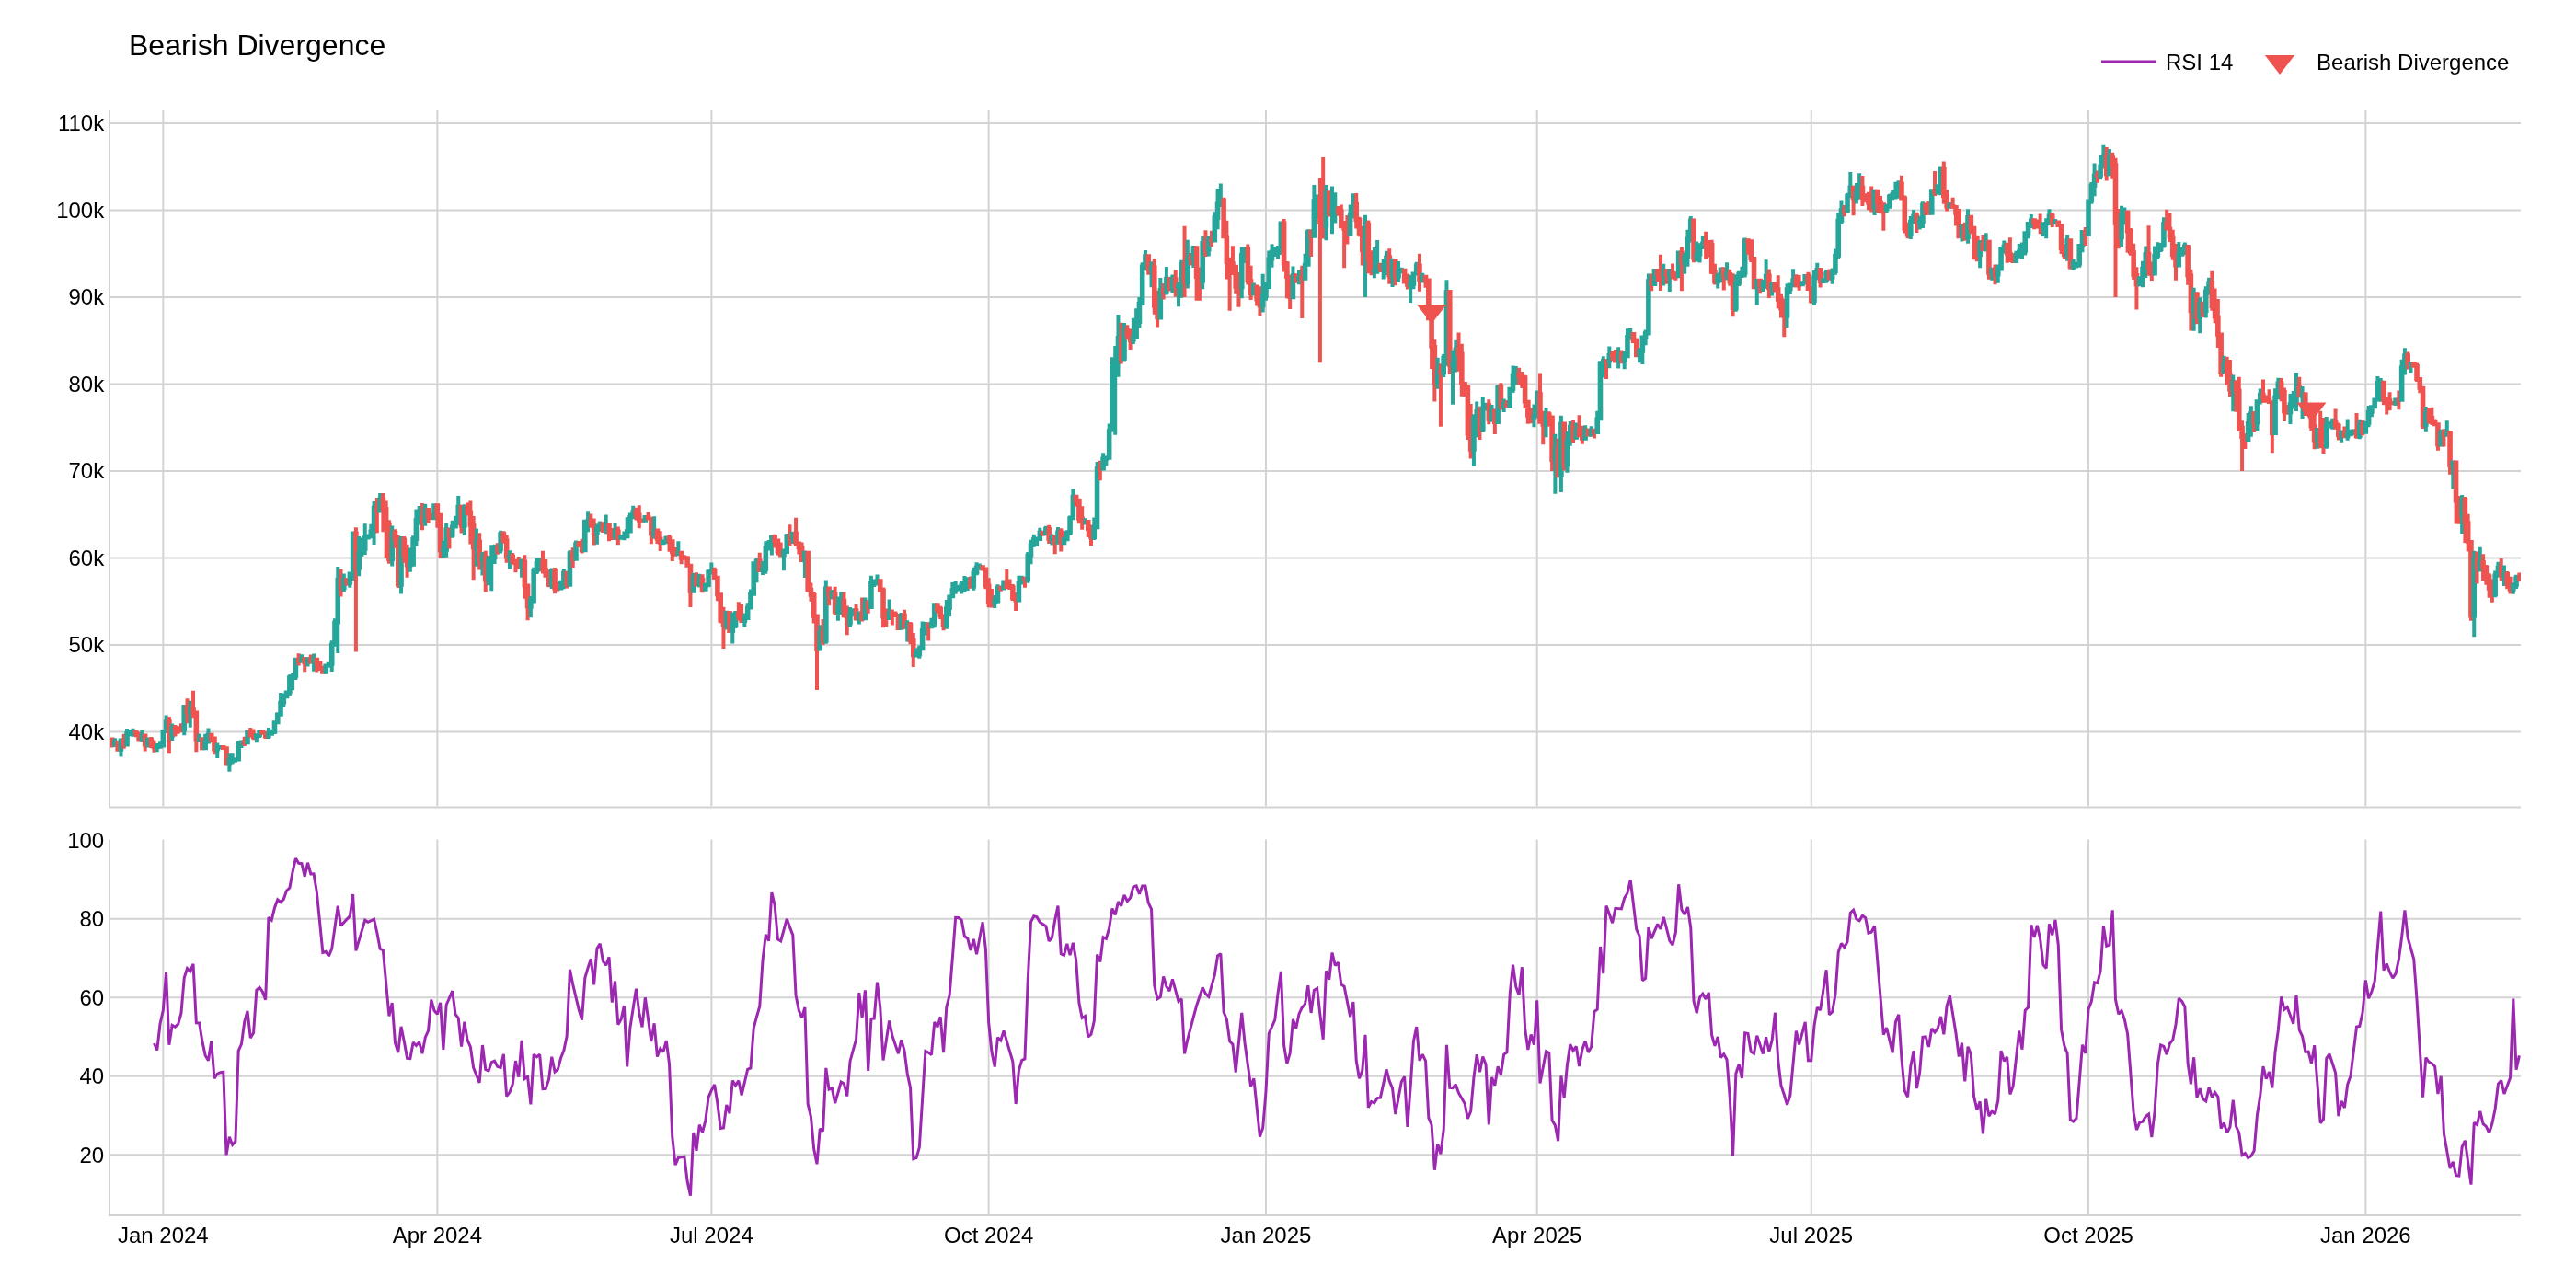
The image above uses the following parameters:
| Parameter | Value |
|---|---|
first_column | Close |
second_column | RSI_14 |