Detect Peaks
Minimum bars needed: 2 × number_of_neighbors_to_compare + 1 bars
(default params: 11 bars (number_of_neighbors_to_compare=5))
Needs number_of_neighbors_to_compare bars on each side of a candidate peak. After warmup, new peaks are detected in real-time.
✅ After the warmup window is filled, this indicator produces a new value on every incoming bar in real-time.
Peaks are confirmed after comparing with neighboring bars.
| Event | Lag | Detail |
|---|---|---|
| Peak / trough confirmed | ≈ number_of_neighbors_to_compare bars | Needs the specified number of bars on each side to confirm a local extremum |
The detect_peaks function is used to identify peaks and lows in a given column of a DataFrame. It returns a DataFrame with two additional columns: one for higher highs and another for lower lows. The function can be used to detect peaks and lows in a DataFrame. It identifies local maxima and minima based on the specified order of neighboring points. The function can also filter out peaks and lows based on a minimum number of consecutive occurrences. This allows you to focus on significant peaks and lows that are more likely to be relevant for analysis.
There is always a delay between an actual peak and the detection of that peak. This is determined by the
number_of_neighbors_to_compareparameter. For example if for a given column you setnumber_of_neighbors_to_compare=5, the function will look at the 5 previous and 5 next data points to determine if the current point is a peak or a low. This means that the peak or low will only be detected after the 5th data point has been processed. So say you have OHLCV data of 15 minute intervals, and you setnumber_of_neighbors_to_compare=5, the function will only detect the peak or low after the 5th data point has been processed, which means that there will be a delay of 75 minutes (5 * 15 minutes) before the peak or low is detected.
def detect_peaks(
    data: Union[PdDataFrame, PlDataFrame],
    column: str,
    number_of_neighbors_to_compare: int = 5,
    min_consecutive: int = 2
) -> Union[PdDataFrame, PlDataFrame]:
Example
from investing_algorithm_framework import download
from pyindicators import detect_peaks

pl_df = download(
    symbol="btc/eur",
    market="binance",
    time_frame="1d",
    start_date="2023-12-01",
    end_date="2023-12-25",
    save=True,
    storage_path="./data"
)

pd_df = download(
    symbol="btc/eur",
    market="binance",
    time_frame="1d",
    start_date="2023-12-01",
    end_date="2023-12-25",
    pandas=True,
    save=True,
    storage_path="./data"
)

# Calculate peaks and lows for Polars DataFrame, with a neighbour comparison of 4 and minimum of 2 consecutive peaks
pl_df = detect_peaks(pl_df, source_column="Close", number_of_neighbors_to_compare=4, min_consecutive=2)
pl_df.show(10)

# Calculate peaks and lows for Pandas DataFrame, with a neighbour comparison of 4 and minimum of 2 consecutive peaks
pd_df = detect_peaks(pd_df, source_column="Close", number_of_neighbors_to_compare=4, min_consecutive=2)
pd_df.tail(10)
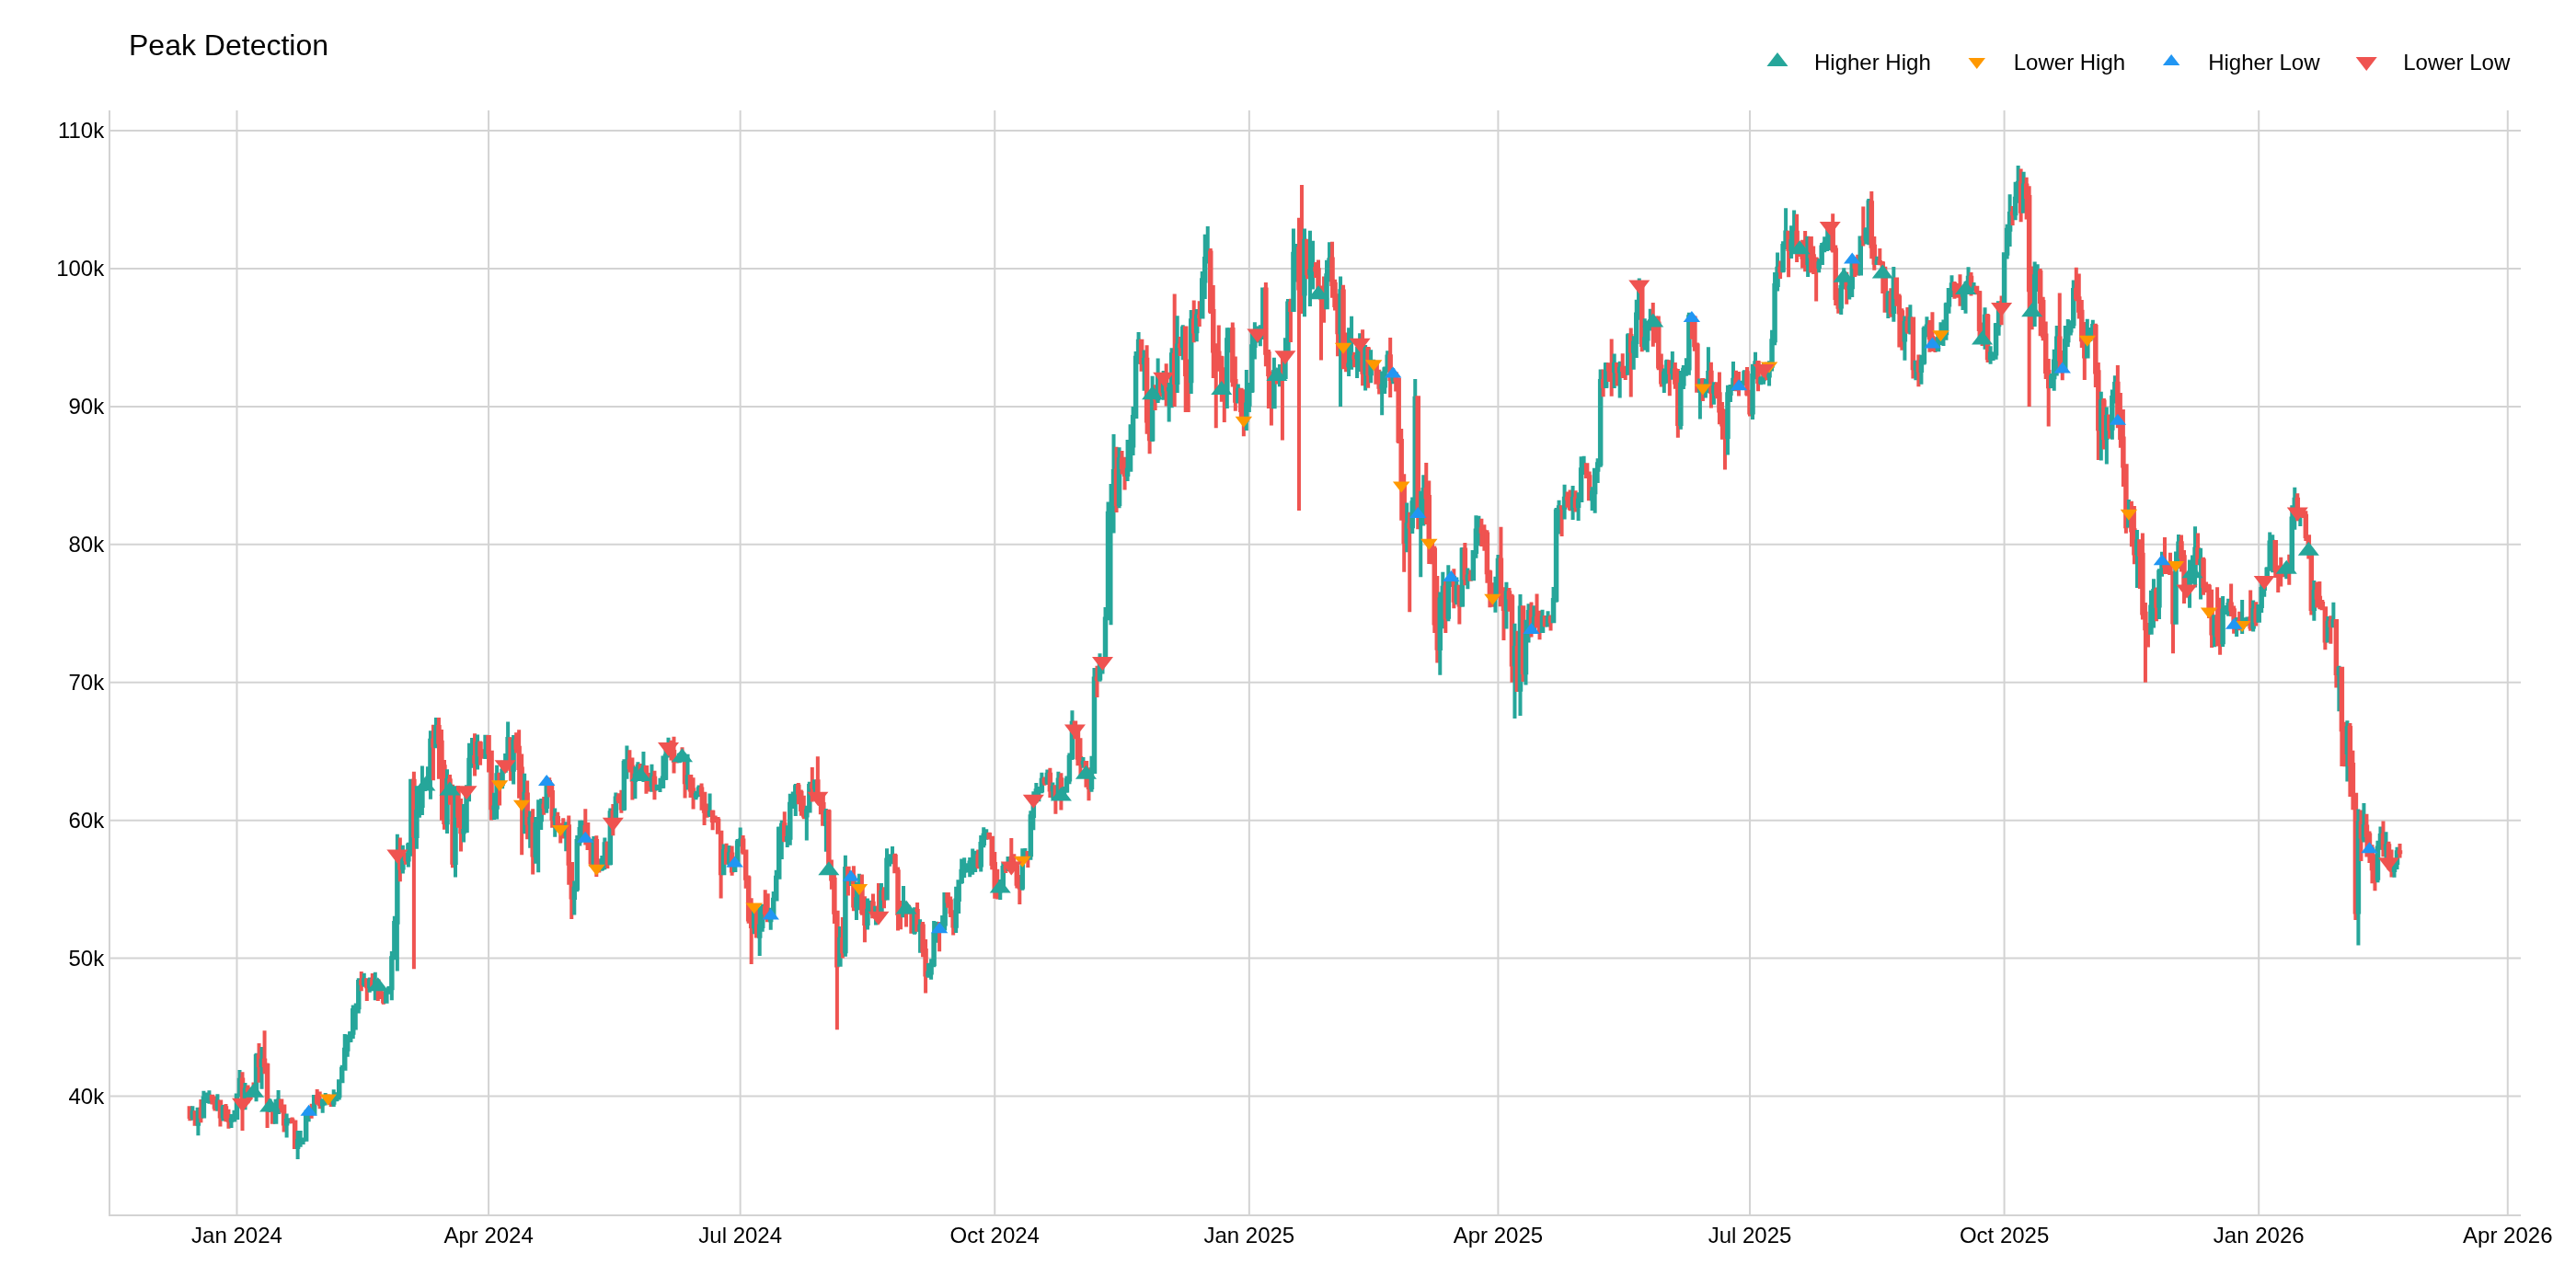
The image above uses the following parameters:
| Parameter | Value |
|---|---|
source_column | Close |
number_of_neighbors_to_compare | 5 |