Detect Bullish Divergence
Minimum bars needed: 2 × number_of_neighbors_to_compare + 1 bars
(default params: 11 bars (number_of_neighbors_to_compare=5))
Requires confirmed peaks in both price and indicator, inheriting the peak detection warmup. After warmup, divergences are detected in real-time.
✅ After the warmup window is filled, this indicator produces a new value on every incoming bar in real-time.
Divergence signals fire after peak confirmation.
| Event | Lag | Detail |
|---|---|---|
| Bullish divergence signal fires | ≈ number_of_neighbors_to_compare bars after the peak | Requires confirmed peaks in both price and indicator; inherits peak detection delay |
The detect_bullish_divergence function is used to identify bullish divergences between two columns in a DataFrame. It checks for bullish divergences based on the peaks and lows detected in the specified columns. The function returns a DataFrame with additional columns indicating the presence of bullish divergences.
A bullish divergence occurs when the price makes a lower low while the indicator makes a higher low. This suggests that the downward momentum is weakening, and a potential reversal to the upside may occur.
!Important: This function expects that for two given columns there will be corresponding peaks and lows columns. This means that before you can use this function, you must first call the detect_peaks function on both columns. For example: if you want to detect bullish divergence between the "Close" column and the "RSI_14" column, you must first call detect_peaks on both columns. If no corresponding
{column}_peaks and{column}_lows columns are found, the function will raise a PyIndicatorException.
def bullish_divergence(
    data: Union[pd.DataFrame, pl.DataFrame],
    first_column: str,
    second_column: str,
    window_size=1,
    result_column: str = "bullish_divergence",
    number_of_neighbors_to_compare: int = 5,
    min_consecutive: int = 2
) -> Union[pd.DataFrame, pl.DataFrame]:
Example
from investing_algorithm_framework import download
from pyindicators import bullish_divergence
pl_df = download(
    symbol="btc/eur",
    market="binance",
    time_frame="1d",
    start_date="2023-12-01",
    end_date="2023-12-25",
    save=True,
    storage_path="./data"
)
pd_df = download(
    symbol="btc/eur",
    market="binance",
    time_frame="1d",
    start_date="2023-12-01",
    end_date="2023-12-25",
    pandas=True,
    save=True,
    storage_path="./data"
)

# Calculate bearish divergence for Polars DataFrame, treat first_column always as the indicator column
pl_df = bearish_divergence(pl_df, first_column="RSI_14", second_column="Close", window_size=8)
pl_df.show(10)

# Calculate bearish divergence for Pandas DataFrame
pd_df = bearish_divergence(pd_df, first_column="RSI_14", second_column="Close", window_size=8)
pd_df.tail(10)
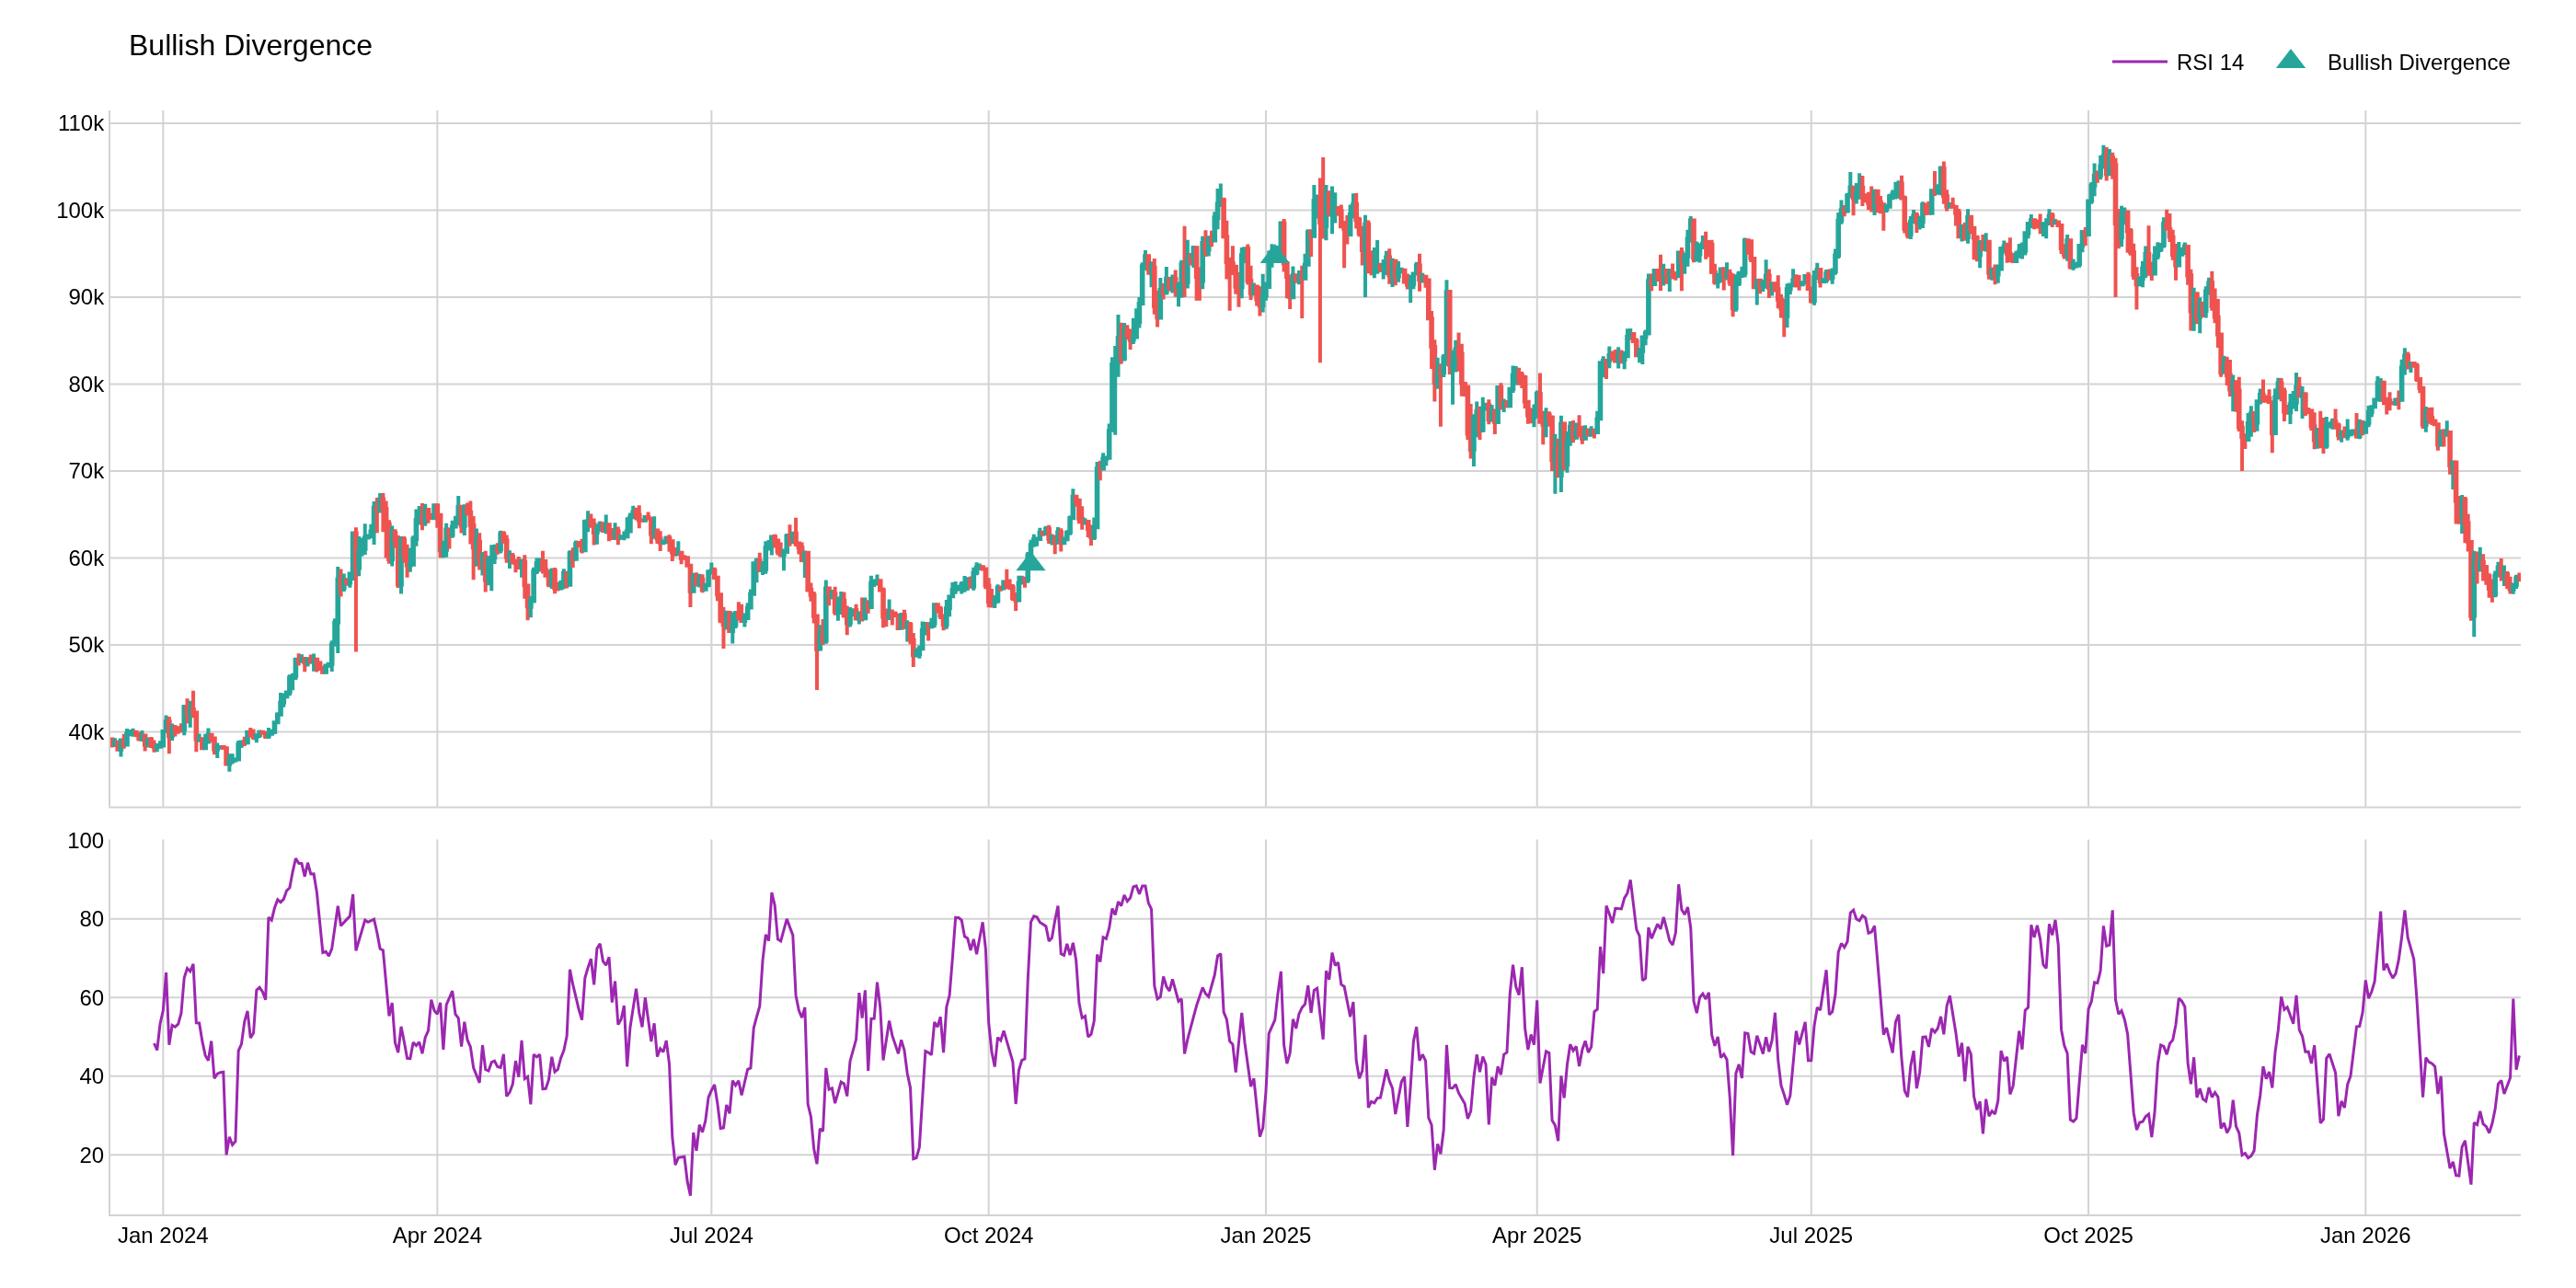
The image above uses the following parameters:
| Parameter | Value |
|---|---|
first_column | Close |
second_column | RSI_14 |