Average True Range (ATR)
Warmup Window
Minimum bars needed: period bars
(default params: 14 bars (period=14))
Wilder's RMA needs period bars for the initial average true range. After warmup, ATR updates in real-time on every new bar.
✅ After the warmup window is filled, this indicator produces a new value on every incoming bar in real-time.
Lagging Indicator
ATR readings lag behind actual volatility changes.
| Event | Lag | Detail |
|---|---|---|
| ATR reacts to a volatility spike | ≈ period / 2 bars | Wilder's RMA smoothing over the specified period |
| ATR reacts to volatility contraction | ≈ period / 2 bars | Same smoothing; contractions are also detected late |
Formula for custom params: lag ≈ period / 2
The Average True Range (ATR) is a volatility indicator that measures the average range between the high and low prices over a specified period. It helps traders identify potential price fluctuations and adjust their strategies accordingly.
def atr(
    data: Union[PdDataFrame, PlDataFrame],
    source_column="Close",
    period=14,
    result_column="ATR"
) -> Union[PdDataFrame, PlDataFrame]:
Example
from investing_algorithm_framework import download

from pyindicators import atr

pl_df = download(
    symbol="btc/eur",
    market="binance",
    time_frame="1d",
    start_date="2023-12-01",
    end_date="2023-12-25",
    save=True,
    storage_path="./data"
)
pd_df = download(
    symbol="btc/eur",
    market="binance",
    time_frame="1d",
    start_date="2023-12-01",
    end_date="2023-12-25",
    pandas=True,
    save=True,
    storage_path="./data"
)

# Calculate average true range for Polars DataFrame
pl_df = atr(pl_df, source_column="Close")
pl_df.show(10)

# Calculate average true range for Pandas DataFrame
pd_df = atr(pd_df, source_column="Close")
pd_df.tail(10)
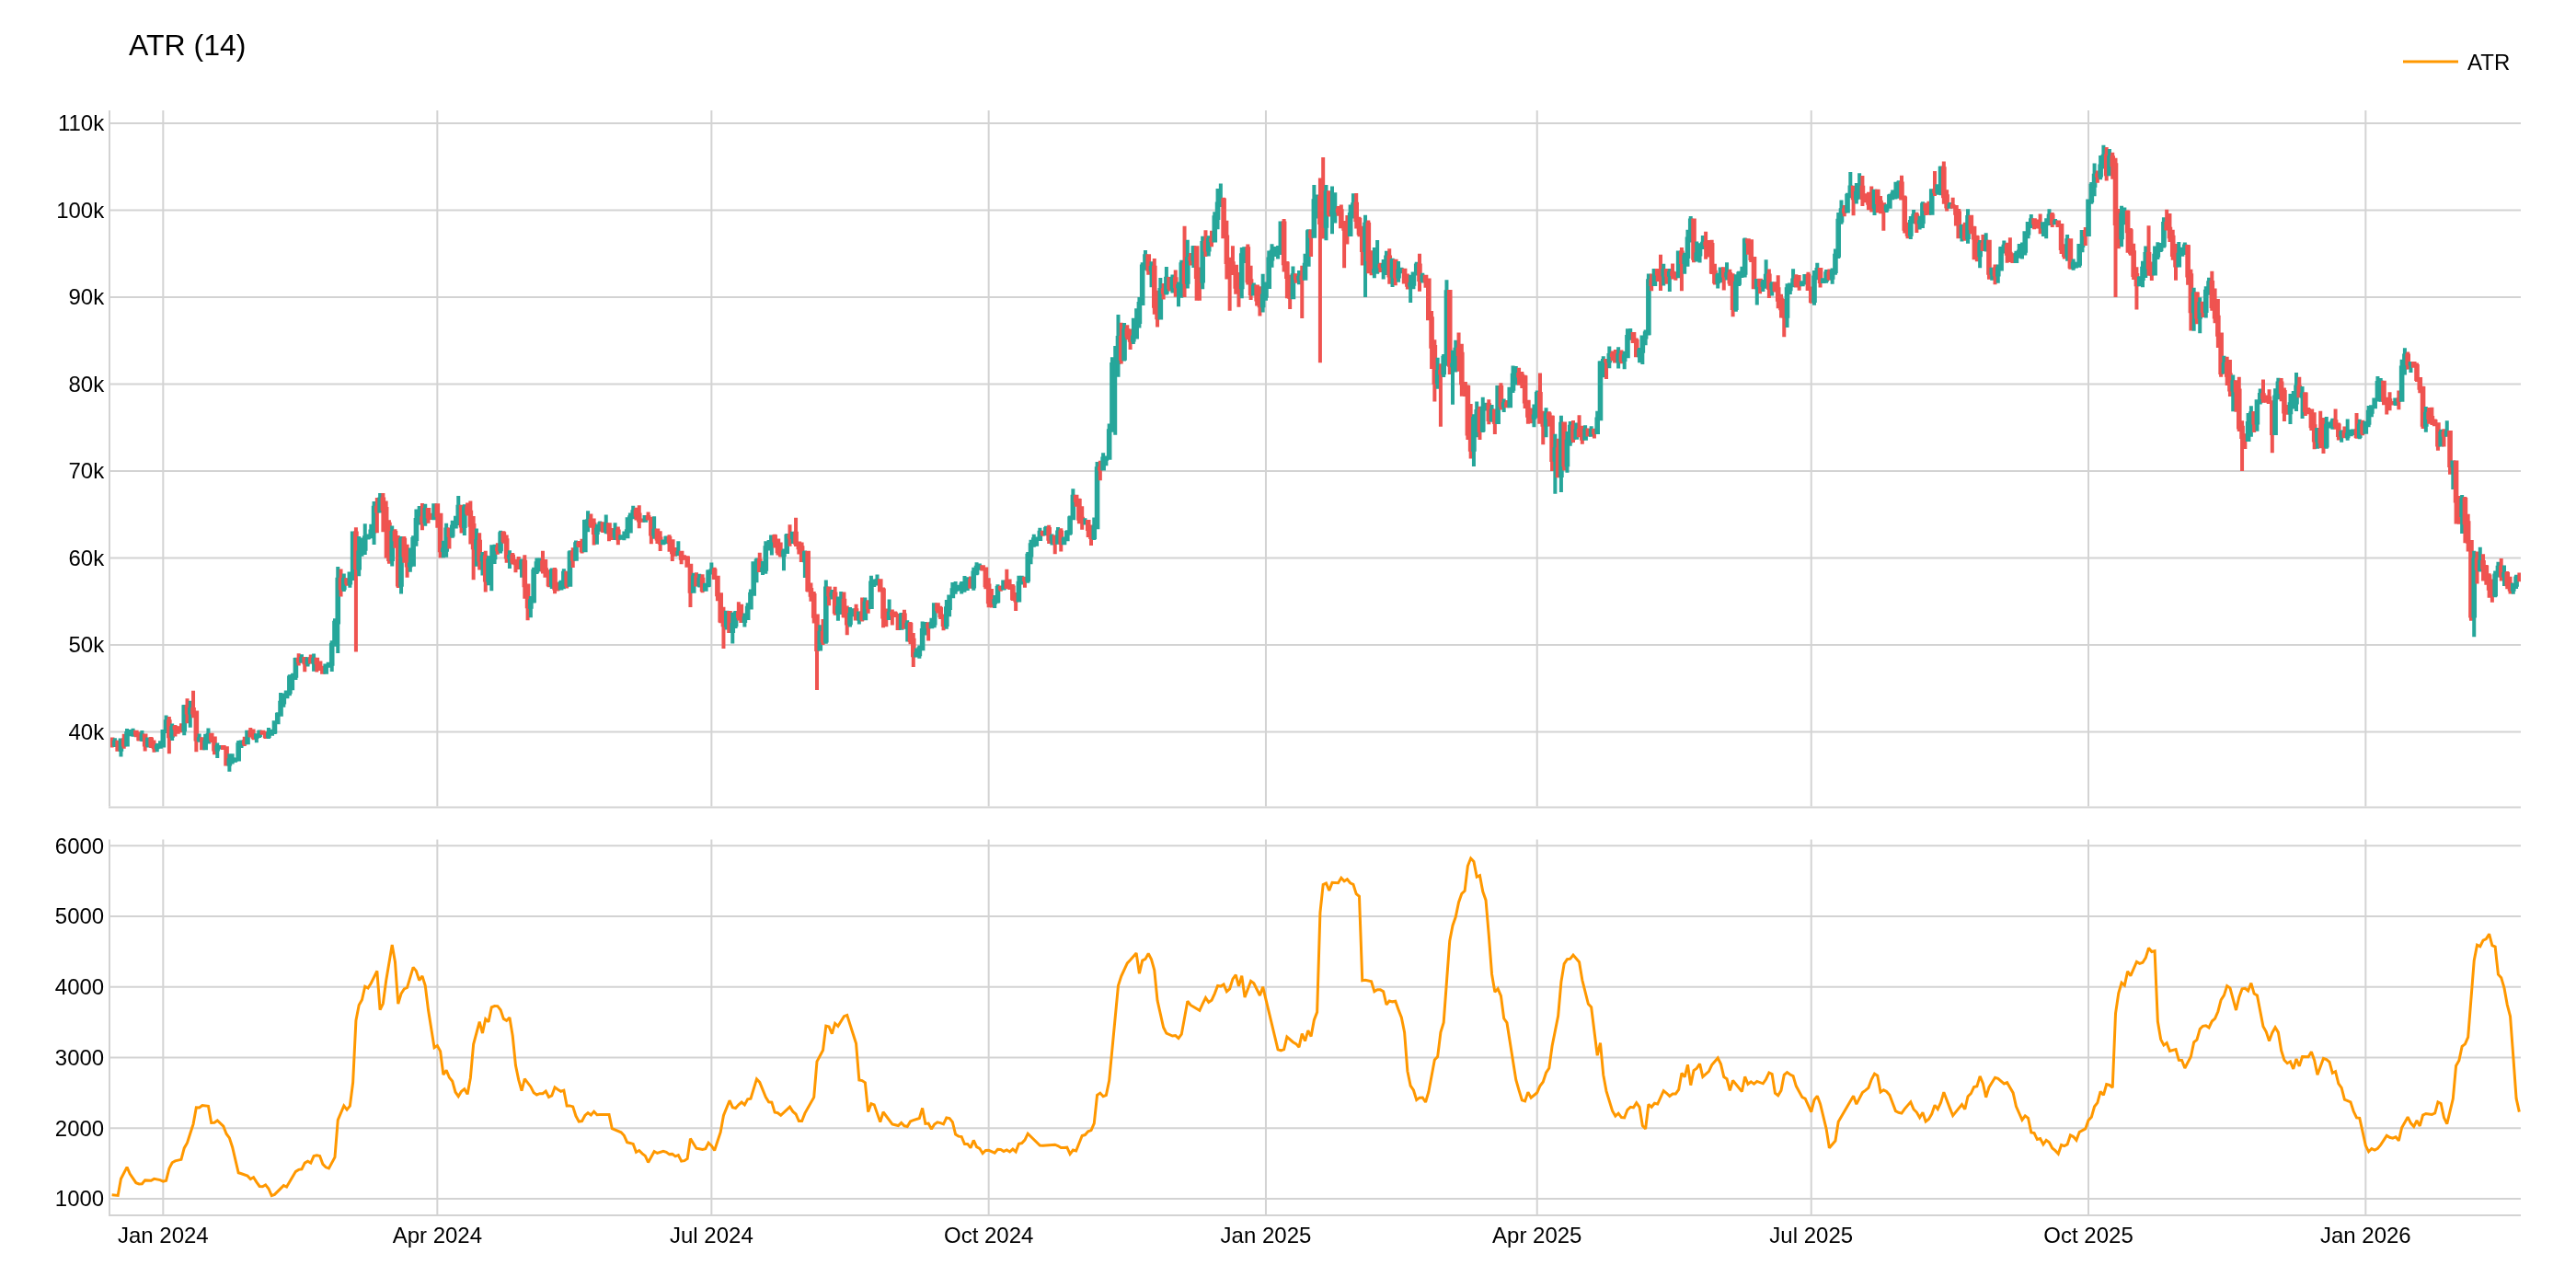
Chart Parameters
The image above uses the following parameters:
| Parameter | Value |
|---|---|
source_column | Close |
period | 14 |