Bollinger Bands Overshoot
Warmup Window
Minimum bars needed: period bars
(default params: 20 bars (period=20))
Built on Bollinger Bands — same warmup as BB. After warmup, the overshoot value updates in real-time.
✅ After the warmup window is filled, this indicator produces a new value on every incoming bar in real-time.
Lagging Indicator
Inherits the same lag as Bollinger Bands.
| Event | Lag | Detail |
|---|---|---|
| Overshoot value reacts to price move | ≈ period / 2 bars | Inherits SMA + std dev lag from BB |
| Overshoot crosses zero | ≈ period / 2 bars | Same underlying Bollinger Bands smoothing |
Formula for custom params: lag ≈ period / 2
Bollinger Bands Overshoot measures how far the price has exceeded the upper or lower Bollinger Band, expressed as a percentage of the half-band width (distance from middle to upper/lower band). This indicator helps identify extreme price movements and potential mean reversion opportunities.
Calculation:
- When price > upper band (bullish overshoot):
((Price - Upper Band) / (Upper Band - Middle Band)) × 100 - When price < lower band (bearish overshoot):
((Price - Lower Band) / (Middle Band - Lower Band)) × 100 - When price is within bands:
0%
Interpretation:
- Positive values indicate overbought conditions (price above upper band)
- Negative values indicate oversold conditions (price below lower band)
- High overshoots (e.g., 40%) indicate increased risk of mean reversion
def bollinger_overshoot(
    data: Union[PdDataFrame, PlDataFrame],
    source_column='Close',
    period=20,
    std_dev=2,
    result_column='bollinger_overshoot'
) -> Union[PdDataFrame, PlDataFrame]:
Example
from investing_algorithm_framework import download

from pyindicators import bollinger_overshoot

pl_df = download(
    symbol="btc/eur",
    market="binance",
    time_frame="1d",
    start_date="2023-12-01",
    end_date="2023-12-25",
    save=True,
    storage_path="./data"
)
pd_df = download(
    symbol="btc/eur",
    market="binance",
    time_frame="1d",
    start_date="2023-12-01",
    end_date="2023-12-25",
    pandas=True,
    save=True,
    storage_path="./data"
)

# Calculate Bollinger Bands Overshoot for Polars DataFrame
pl_df = bollinger_overshoot(pl_df, source_column="Close")
pl_df.show(10)

# Calculate Bollinger Bands Overshoot for Pandas DataFrame
pd_df = bollinger_overshoot(pd_df, source_column="Close")
pd_df.tail(10)
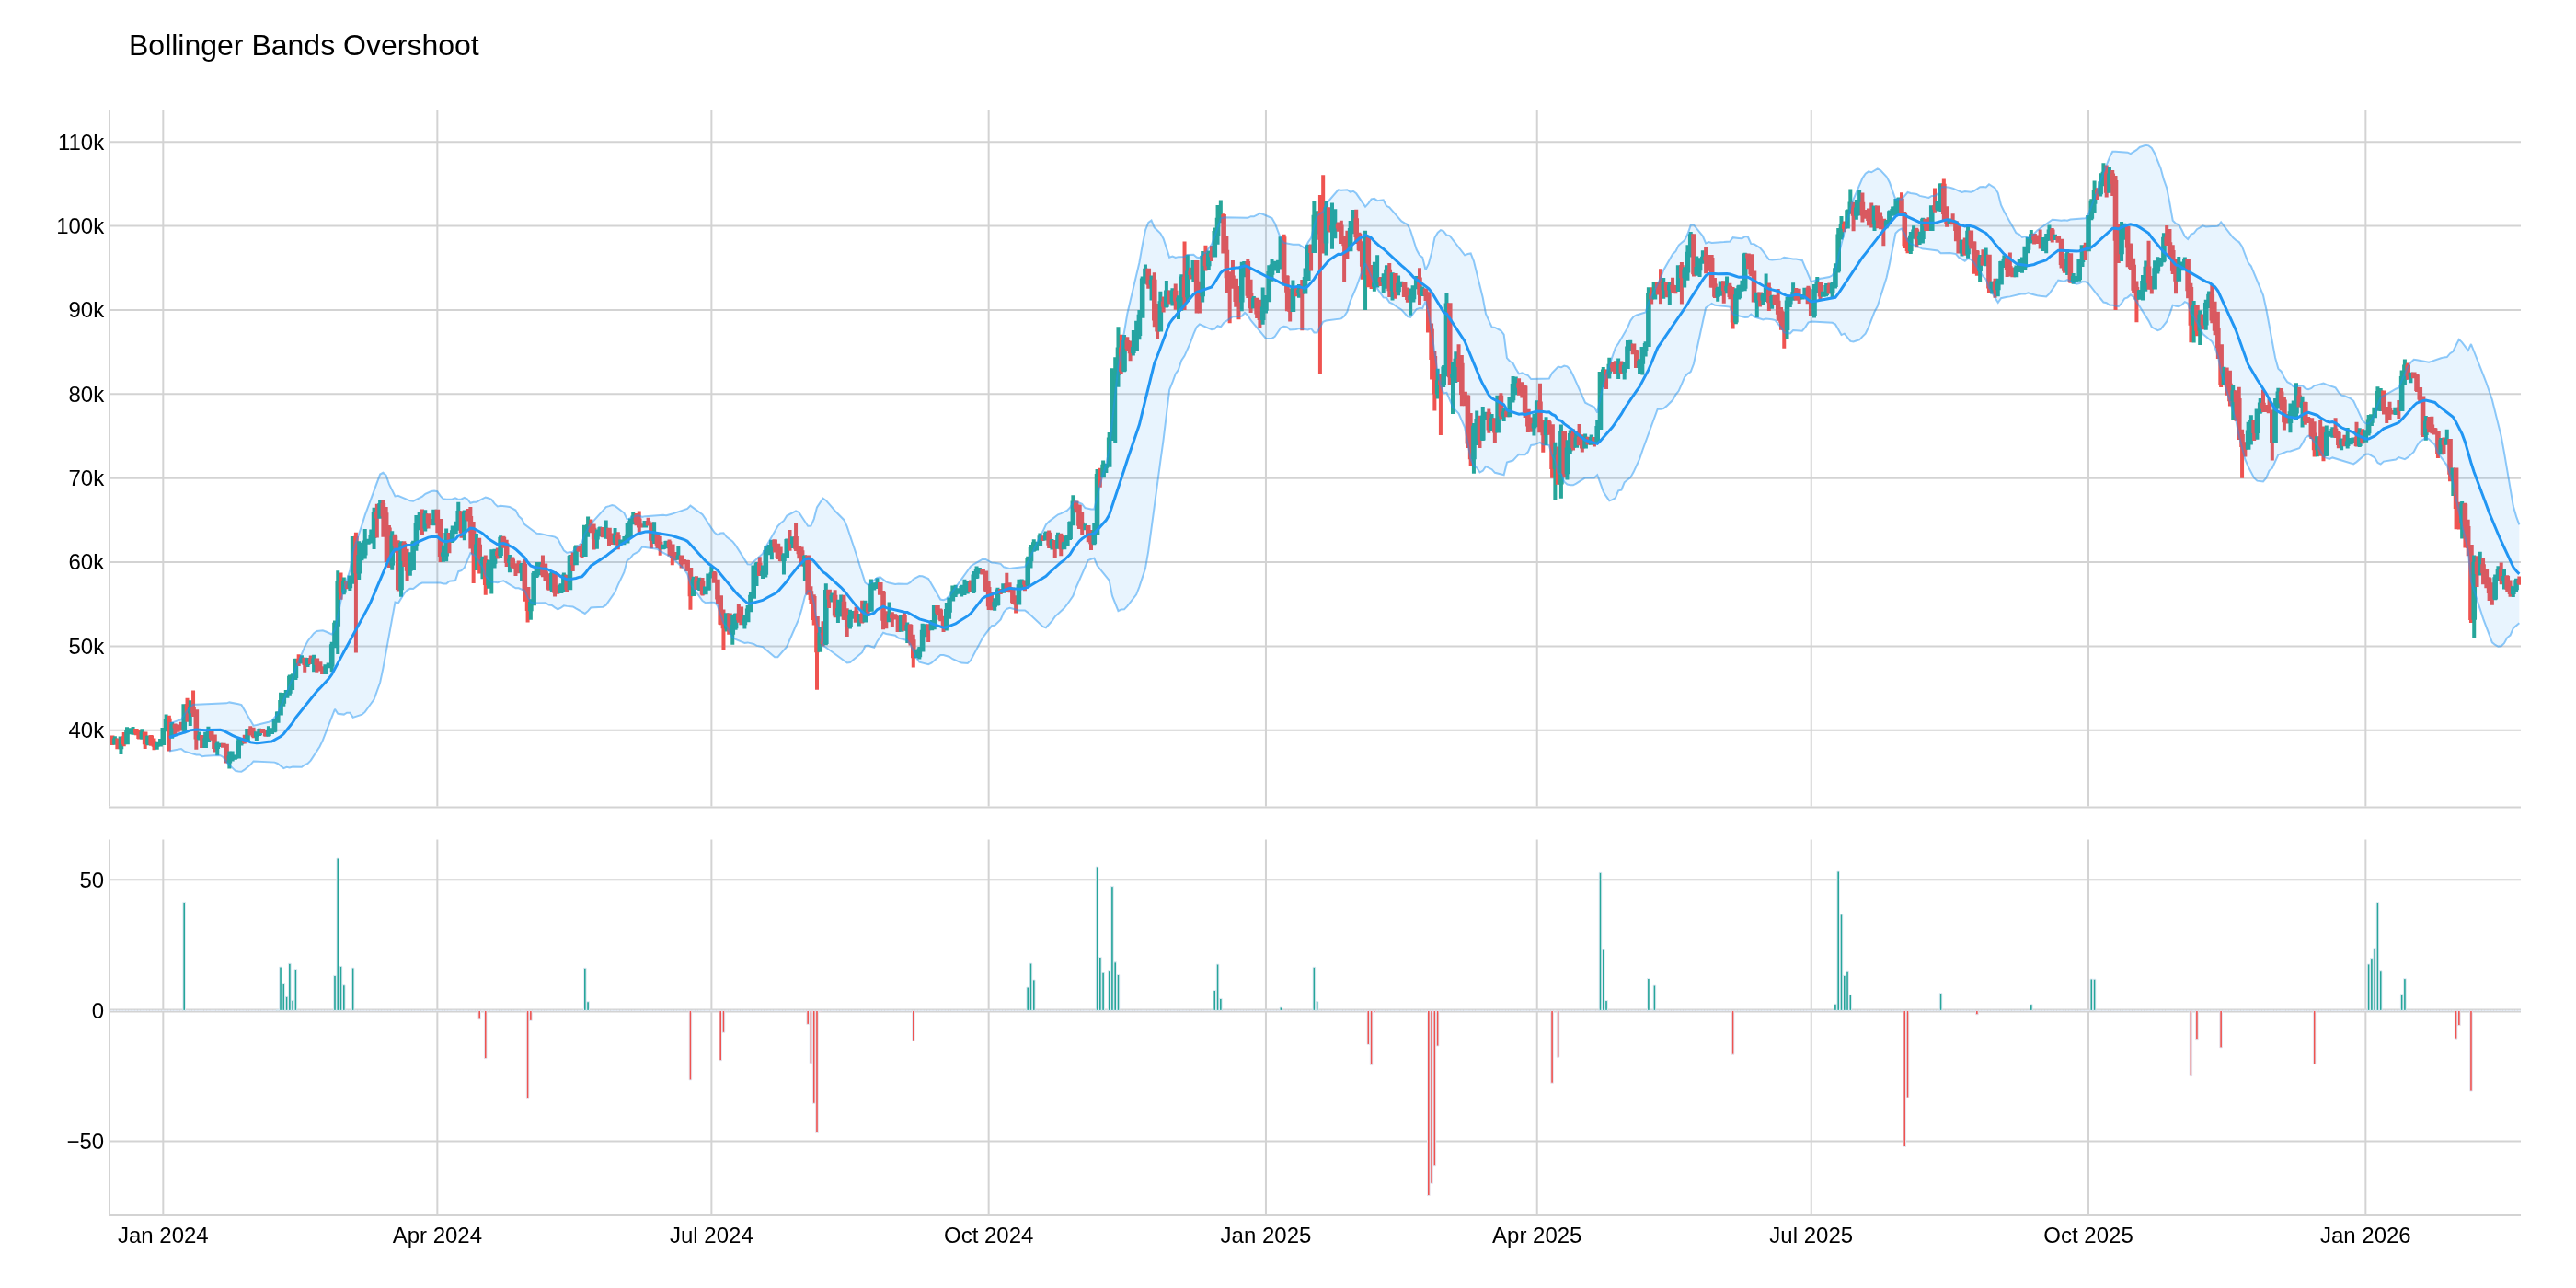
Chart Parameters
The image above uses the following parameters:
| Parameter | Value |
|---|---|
source_column | Close |
period | 20 |
std_dev | 2 |