Nadaraya-Watson Envelope (NWE)
Minimum bars needed: lookback bars
(default params: 500 bars (lookback=500))
The Gaussian kernel regression uses a rolling window of lookback bars. Before that many bars are available, the regression is computed over fewer points. After warmup, the indicator updates in real-time.
✅ After the warmup window is filled, this indicator produces a new value on every incoming bar in real-time.
The kernel regression line and bands lag behind price. Bandwidth controls the tradeoff.
| Event | Lag | Detail |
|---|---|---|
| NWE line reacts to price reversal | bandwidth-dependent | Higher bandwidth = more smoothing = more lag; no fixed bar count |
| Bands widen/narrow after volatility change | bandwidth-dependent | Bands derived from ATR-scaled offsets of the regression line |
Formula for custom params: lag depends on bandwidth (default 8.0); higher = smoother = more lag
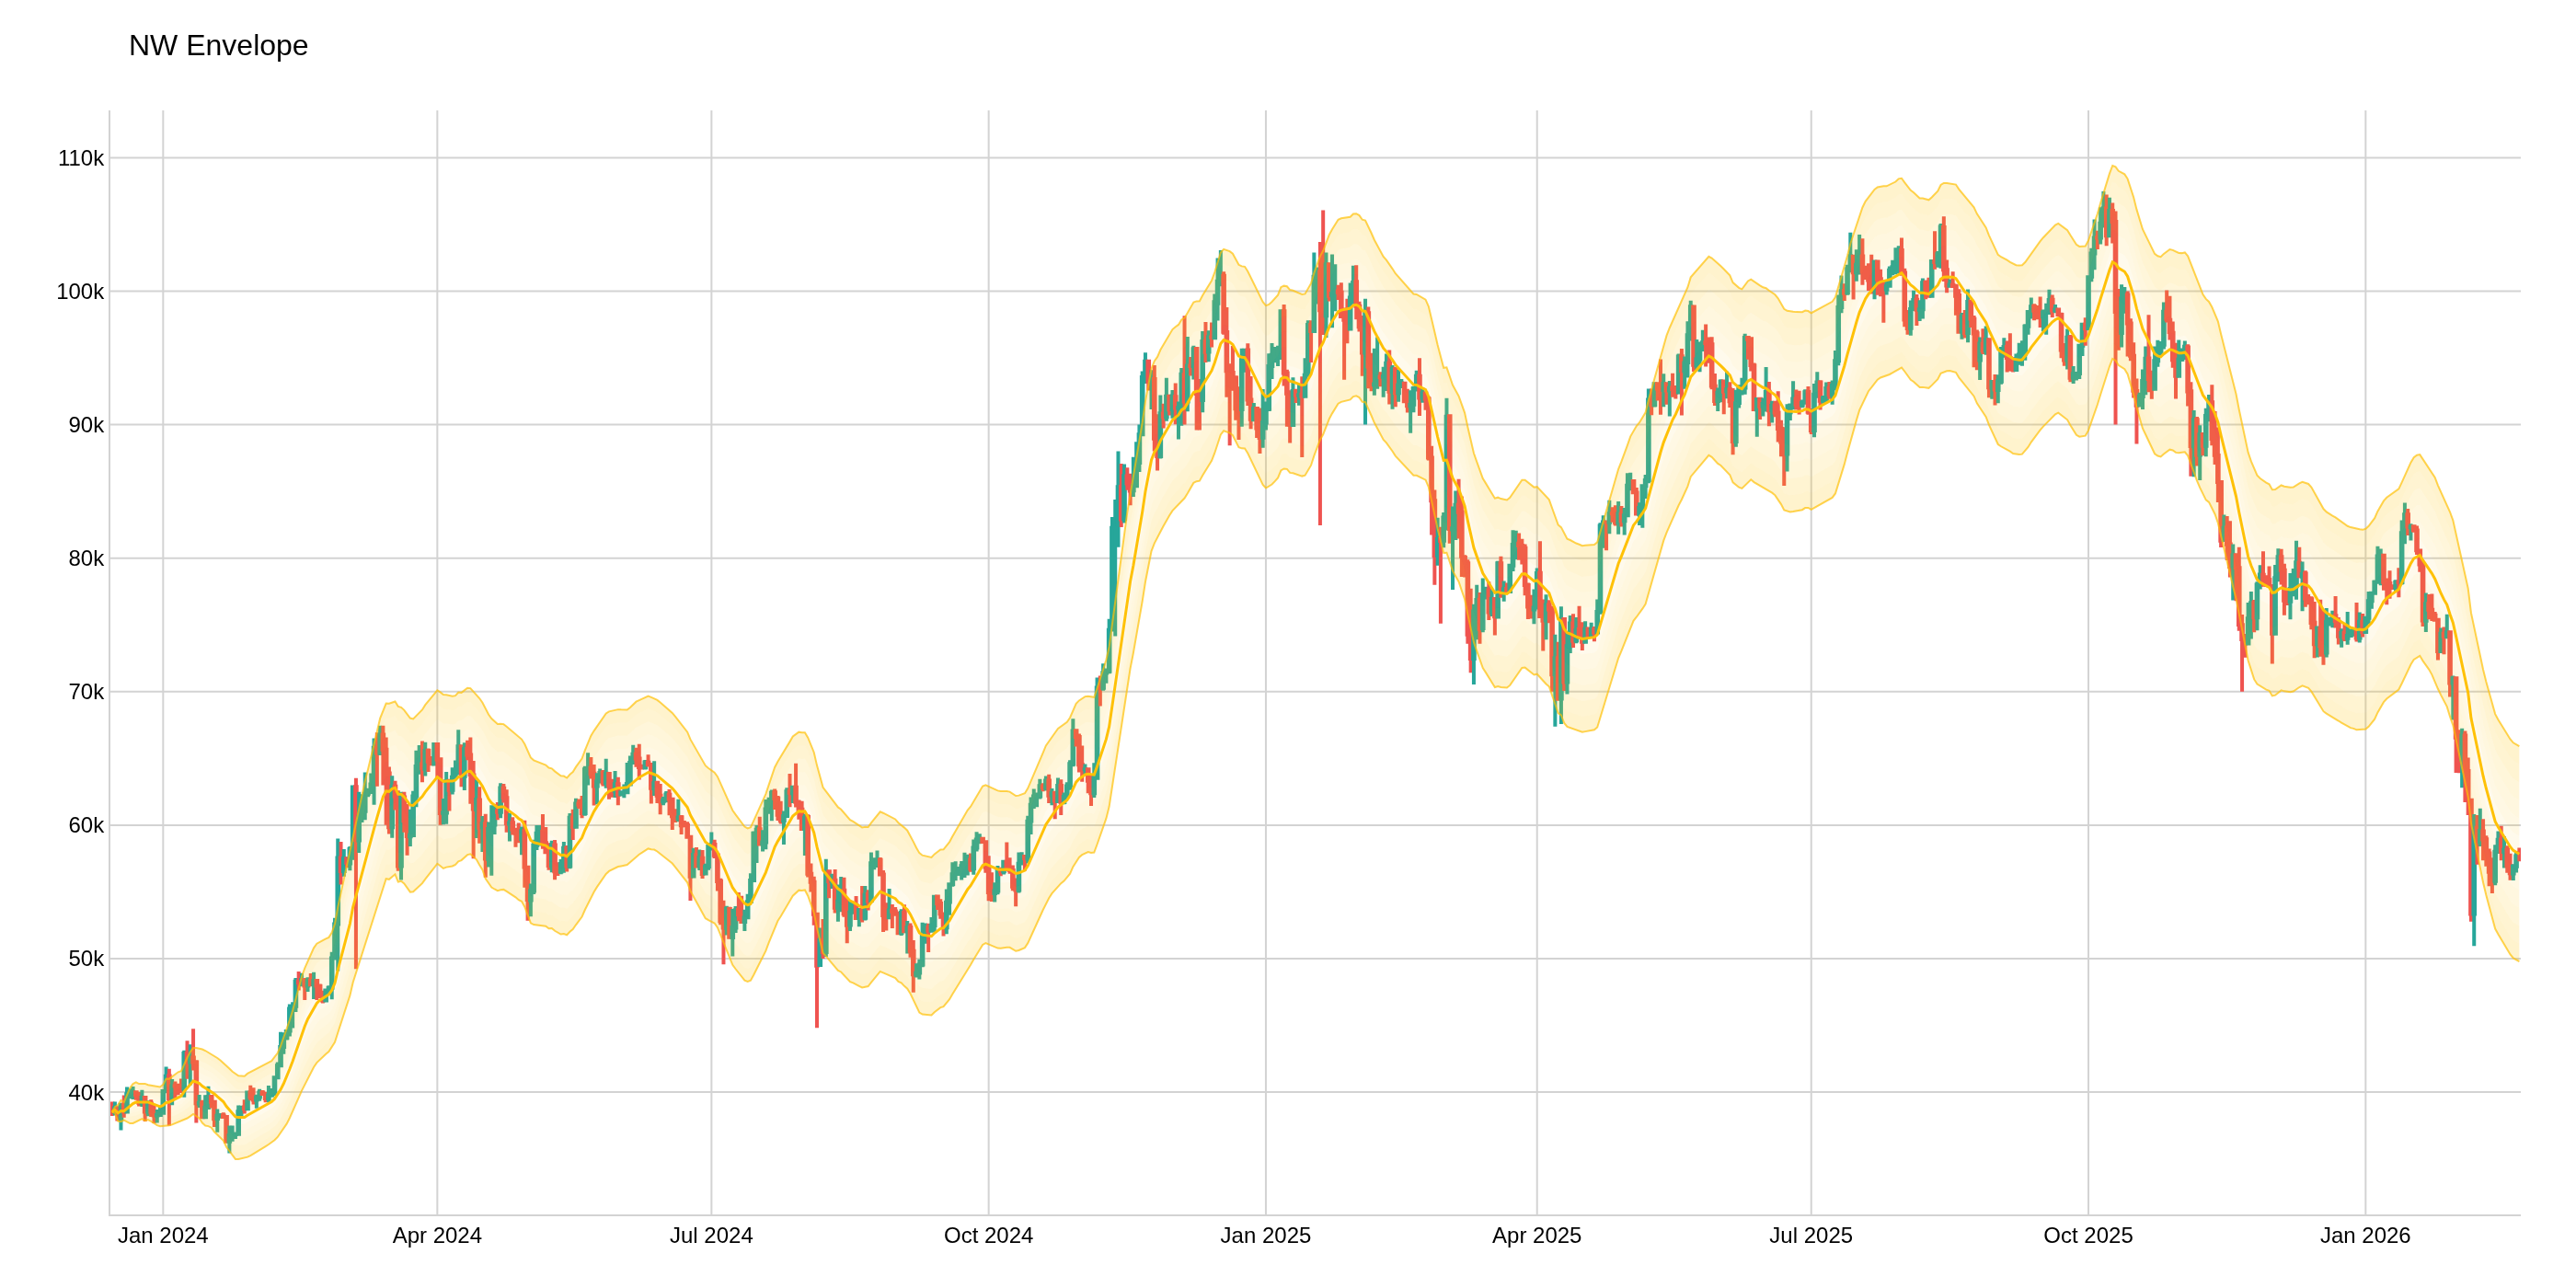
The Nadaraya-Watson Envelope uses Gaussian kernel regression to create a smoothed price estimate, then adds an envelope based on the mean absolute error (MAE) scaled by a multiplier. This is a non-repainting (endpoint) implementation. It is useful for identifying overbought/oversold zones and mean-reversion opportunities.
Calculation:
- Kernel weights:
w(i) = exp(-i² / (2 × h²))fori = 0..lookback-1 - Smoothed value:
sum(src[t-i] × w(i)) / sum(w(i)) - MAE: SMA of
|src - smoothed|over the lookback period - Upper:
smoothed + mult × MAE - Lower:
smoothed - mult × MAE
def nadaraya_watson_envelope(
    data: Union[PdDataFrame, PlDataFrame],
    source_column: str = 'Close',
    bandwidth: float = 8.0,
    mult: float = 3.0,
    lookback: int = 500,
    upper_column: str = 'nwe_upper',
    lower_column: str = 'nwe_lower',
    middle_column: str = 'nwe_middle',
) -> Union[PdDataFrame, PlDataFrame]:
Example
from investing_algorithm_framework import download

from pyindicators import nadaraya_watson_envelope

pl_df = download(
    symbol="btc/eur",
    market="binance",
    time_frame="1d",
    start_date="2023-12-01",
    end_date="2023-12-25",
    save=True,
    storage_path="./data"
)
pd_df = download(
    symbol="btc/eur",
    market="binance",
    time_frame="1d",
    start_date="2023-12-01",
    end_date="2023-12-25",
    pandas=True,
    save=True,
    storage_path="./data"
)

# Calculate Nadaraya-Watson Envelope for Polars DataFrame
pl_df = nadaraya_watson_envelope(pl_df, source_column="Close", bandwidth=8.0, mult=3.0)
pl_df.show(10)

# Calculate Nadaraya-Watson Envelope for Pandas DataFrame
pd_df = nadaraya_watson_envelope(pd_df, source_column="Close", bandwidth=8.0, mult=3.0)
pd_df.tail(10)
Support and Resistance
Indicators that help identify potential support and resistance levels in the market.
The image above uses the following parameters:
| Parameter | Value |
|---|---|
source_column | Close |
bandwidth | 8.0 |
mult | 3.0 |
lookback | 500 |