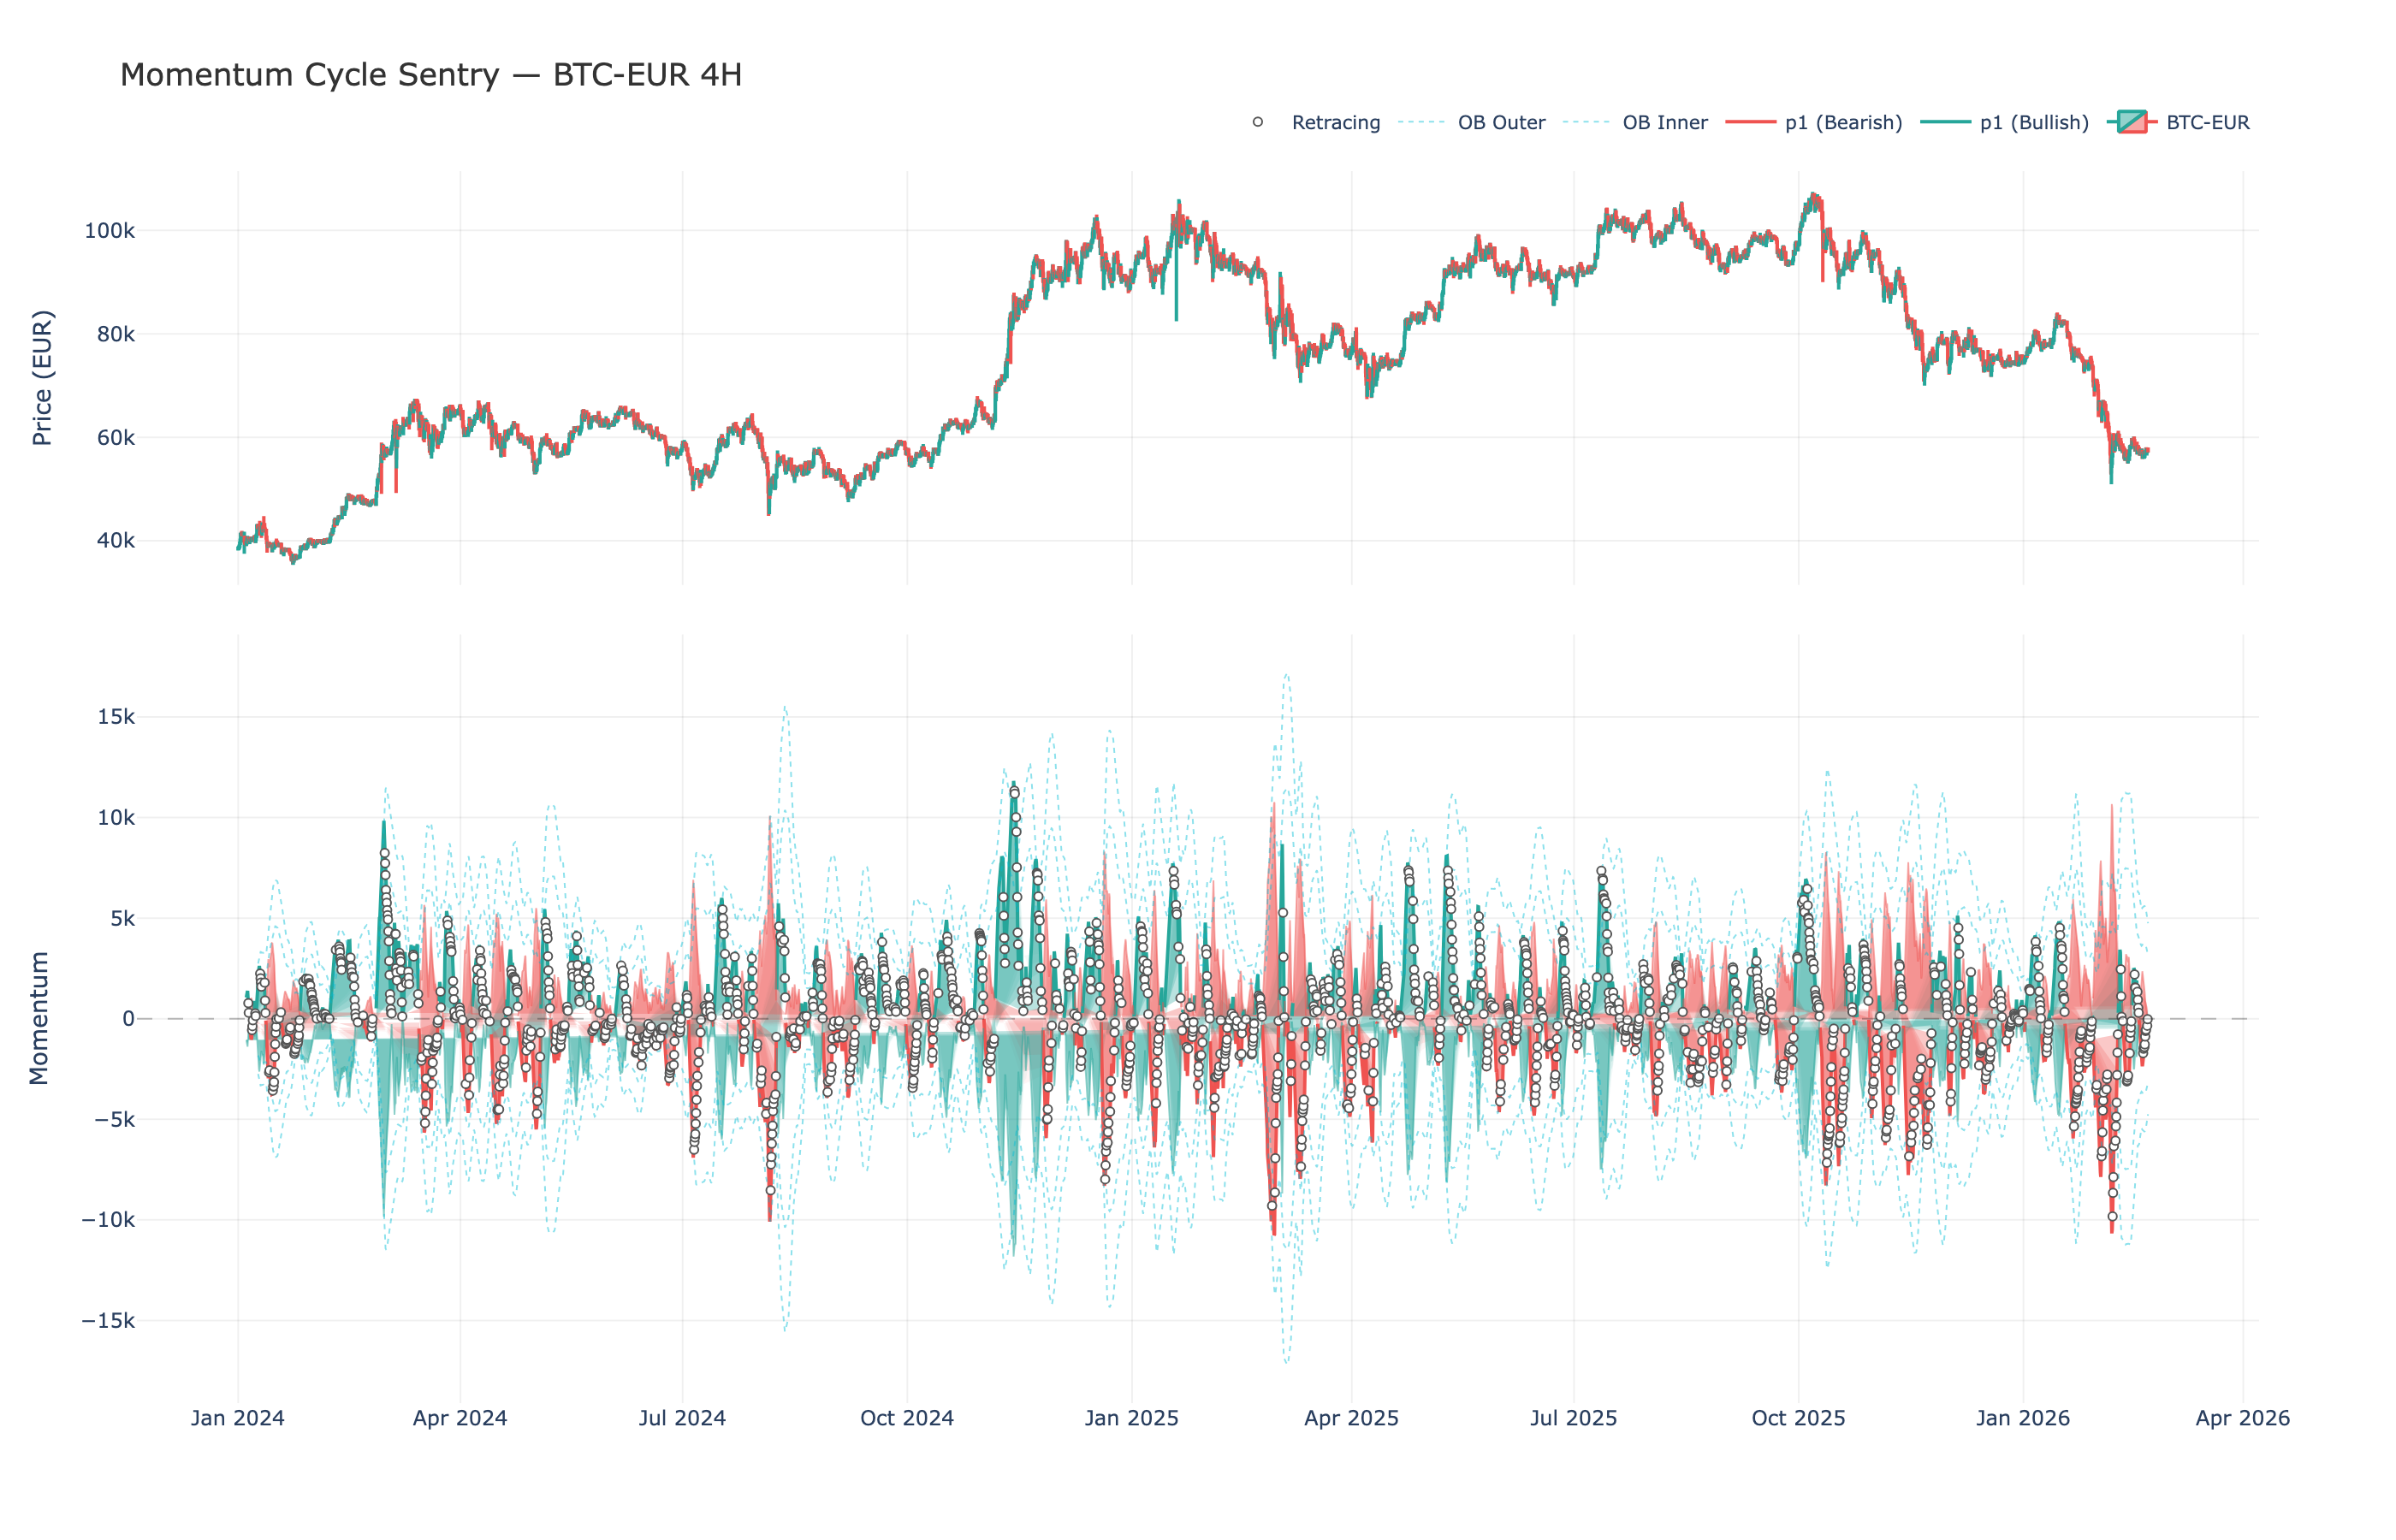
Momentum Cycle Sentry
Lagging Indicator
The multi-layer EMA smoothing and momentum lookback introduce lag relative to the actual price action.
| Event | Lag | Detail |
|---|---|---|
| Raw momentum calculation | = length bars | Close − Close[length] (default length=20) |
| Fast layer (p1) | ≈ smoothing bars | EMA with period = smoothing (default 5) |
| Slowest layer (p5) | ≈ smoothing×5 bars | EMA with period = smoothing × 5 (default 25) |
| OB/OS corridor shift | ≈ ob_lookback/2 bars | Rolling stdev window (default 50) |
| Retracement detection | = retrace_len bars | Requires consecutive falling/rising bars (default 2) |
Formula for custom params: layer lag ≈ smoothing × layer_number, OB/OS lag ≈ ob_lookback / 2
Momentum Cycle Sentry is a multi-layer momentum oscillator ported from the LuxAlgo PineScript indicator. It computes raw momentum, applies five levels of EMA smoothing to create a layered "glow" visualisation, and derives dynamic overbought/oversold corridors from the standard deviation of the fast line.
How it works:
- Compute raw momentum:
Close − Close[length] - Apply EMA smoothing at 5 increasing periods (
smoothing×1throughsmoothing×5) and multiply bymagnitude - Calculate rolling standard deviation of the fast line over
ob_lookbackbars - Build inner and outer OB/OS corridors using the stdev multiplied by
ob_mult_inner/ob_mult_outer - Determine trend direction: bullish when fast line > 0, bearish when < 0
- Detect retracements: when p1 is pulling back (falling in uptrend or rising in downtrend) for
retrace_lenconsecutive bars
def momentum_cycle_sentry(
    data: Union[PdDataFrame, PlDataFrame],
    length: int = 20,
    smoothing: int = 5,
    magnitude: float = 1.0,
    retrace_len: int = 2,
    ob_lookback: int = 50,
    ob_mult_inner: float = 2.0,
    ob_mult_outer: float = 3.0,
    close_column: str = "Close",
) -> Union[PdDataFrame, PlDataFrame]:
Example
from pyindicators import (
    momentum_cycle_sentry,
    momentum_cycle_sentry_signal,
    get_momentum_cycle_sentry_stats,
)

# Calculate Momentum Cycle Sentry
df = momentum_cycle_sentry(df, length=20, smoothing=5)

# Generate trading signals
df = momentum_cycle_sentry_signal(df)

# Get statistics
stats = get_momentum_cycle_sentry_stats(df)
print(f"Bullish bars: {stats['bullish_bars']} ({stats['bullish_pct']}%)")
print(f"Bearish bars: {stats['bearish_bars']} ({stats['bearish_pct']}%)")
print(f"Retracing: {stats['retracing_bars']} ({stats['retracing_pct']}%)")
print(f"Zero crossings: {stats['zero_crossings']}")
Parameters
| Parameter | Type | Default | Description |
|---|---|---|---|
length | int | 20 | Lookback period for raw momentum |
smoothing | int | 5 | Base EMA period — layers use smoothing×1 through smoothing×5 |
magnitude | float | 1.0 | Scalar multiplier for all layers |
retrace_len | int | 2 | Consecutive falling/rising bars required for retracement |
ob_lookback | int | 50 | Rolling window for standard deviation (OB/OS bands) |
ob_mult_inner | float | 2.0 | Inner corridor multiplier |
ob_mult_outer | float | 3.0 | Outer corridor multiplier |
Output Columns
| Column | Description |
|---|---|
mcs_p1 | Fast momentum layer (EMA period = smoothing) |
mcs_p2 | Layer 2 (EMA period = smoothing × 2) |
mcs_p3 | Layer 3 (EMA period = smoothing × 3) |
mcs_p4 | Layer 4 (EMA period = smoothing × 4) |
mcs_p5 | Slowest momentum layer (EMA period = smoothing × 5) |
mcs_ob_inner | Overbought inner corridor (stdev × ob_mult_inner) |
mcs_ob_outer | Overbought outer corridor (stdev × ob_mult_outer) |
mcs_os_inner | Oversold inner corridor (-stdev × ob_mult_inner) |
mcs_os_outer | Oversold outer corridor (-stdev × ob_mult_outer) |
mcs_trend | Trend direction: 1 bullish, -1 bearish, 0 neutral |
mcs_retracing | 1 when momentum is pulling back within trend, 0 otherwise |
Trend & Retracement
- Trend is determined by the fast line (p1): positive = bullish, negative = bearish
- Retracement is flagged when p1 has been falling for
retrace_lenbars in an uptrend, or rising forretrace_lenbars in a downtrend - The signal function combines both:
+1(bullish, not retracing),-1(bearish, not retracing),0(neutral or retracing)
Signal Values (from momentum_cycle_sentry_signal)
| Signal | Meaning |
|---|---|
1 | Bullish momentum — fast line > 0 and not retracing |
-1 | Bearish momentum — fast line < 0 and not retracing |
0 | Neutral or momentum pulling back (retracing) |
Stats (from get_momentum_cycle_sentry_stats)
| Key | Description |
|---|---|
bullish_bars | Number of bars with trend == 1 |
bearish_bars | Number of bars with trend == -1 |
bullish_pct | Percentage of bullish bars |
bearish_pct | Percentage of bearish bars |
retracing_bars | Number of bars flagged as retracing |
retracing_pct | Percentage of retracing bars |
overbought_bars | Bars where p1 > inner OB corridor |
oversold_bars | Bars where p1 < inner OS corridor |
max_momentum | Maximum p1 value |
min_momentum | Minimum p1 value |
avg_momentum | Mean of absolute p1 values |
zero_crossings | Number of times p1 crossed the zero line |
Chart