Average Directional Index (ADX)
Minimum bars needed: 2 × period bars
(default params: 28 bars (period=14))
First Wilder's smoothing on +DI/−DI needs period bars, then the second smoothing for ADX itself needs another period bars. After warmup, the indicator updates in real-time.
✅ After the warmup window is filled, this indicator produces a new value on every incoming bar in real-time.
ADX is double-smoothed, making it one of the slowest momentum indicators.
| Event | Lag | Detail |
|---|---|---|
| ADX rises above 25 (trend strengthening) | ≈ 2 × period bars | Double Wilder's smoothing: first on DI, then on ADX |
| +DI / −DI crossover (direction change) | ≈ period bars | DI lines have single Wilder's smoothing |
Formula for custom params: DI ≈ period; ADX ≈ 2 × period
The Average Directional Index (ADX) is a trend strength indicator that helps traders identify the strength of a trend, regardless of its direction. It is derived from the Positive Directional Indicator (+DI) and Negative Directional Indicator (-DI) and moves between 0 and 100.
def adx(
    data: Union[PdDataFrame, PlDataFrame],
    period=14,
    adx_result_column="ADX",
    di_plus_result_column="+DI",
    di_minus_result_column="-DI",
) -> Union[PdDataFrame, PlDataFrame]:
Example
from investing_algorithm_framework import download

from pyindicators import adx

pl_df = download(
    symbol="btc/eur",
    market="binance",
    time_frame="1d",
    start_date="2023-12-01",
    end_date="2023-12-25",
    save=True,
    storage_path="./data"
)
pd_df = download(
    symbol="btc/eur",
    market="binance",
    time_frame="1d",
    start_date="2023-12-01",
    end_date="2023-12-25",
    pandas=True,
    save=True,
    storage_path="./data"
)

# Calculate ADX for Polars DataFrame
pl_df = adx(pl_df)
pl_df.show(10)

# Calculate ADX for Pandas DataFrame
pd_df = adx(pd_df)
pd_df.tail(10)
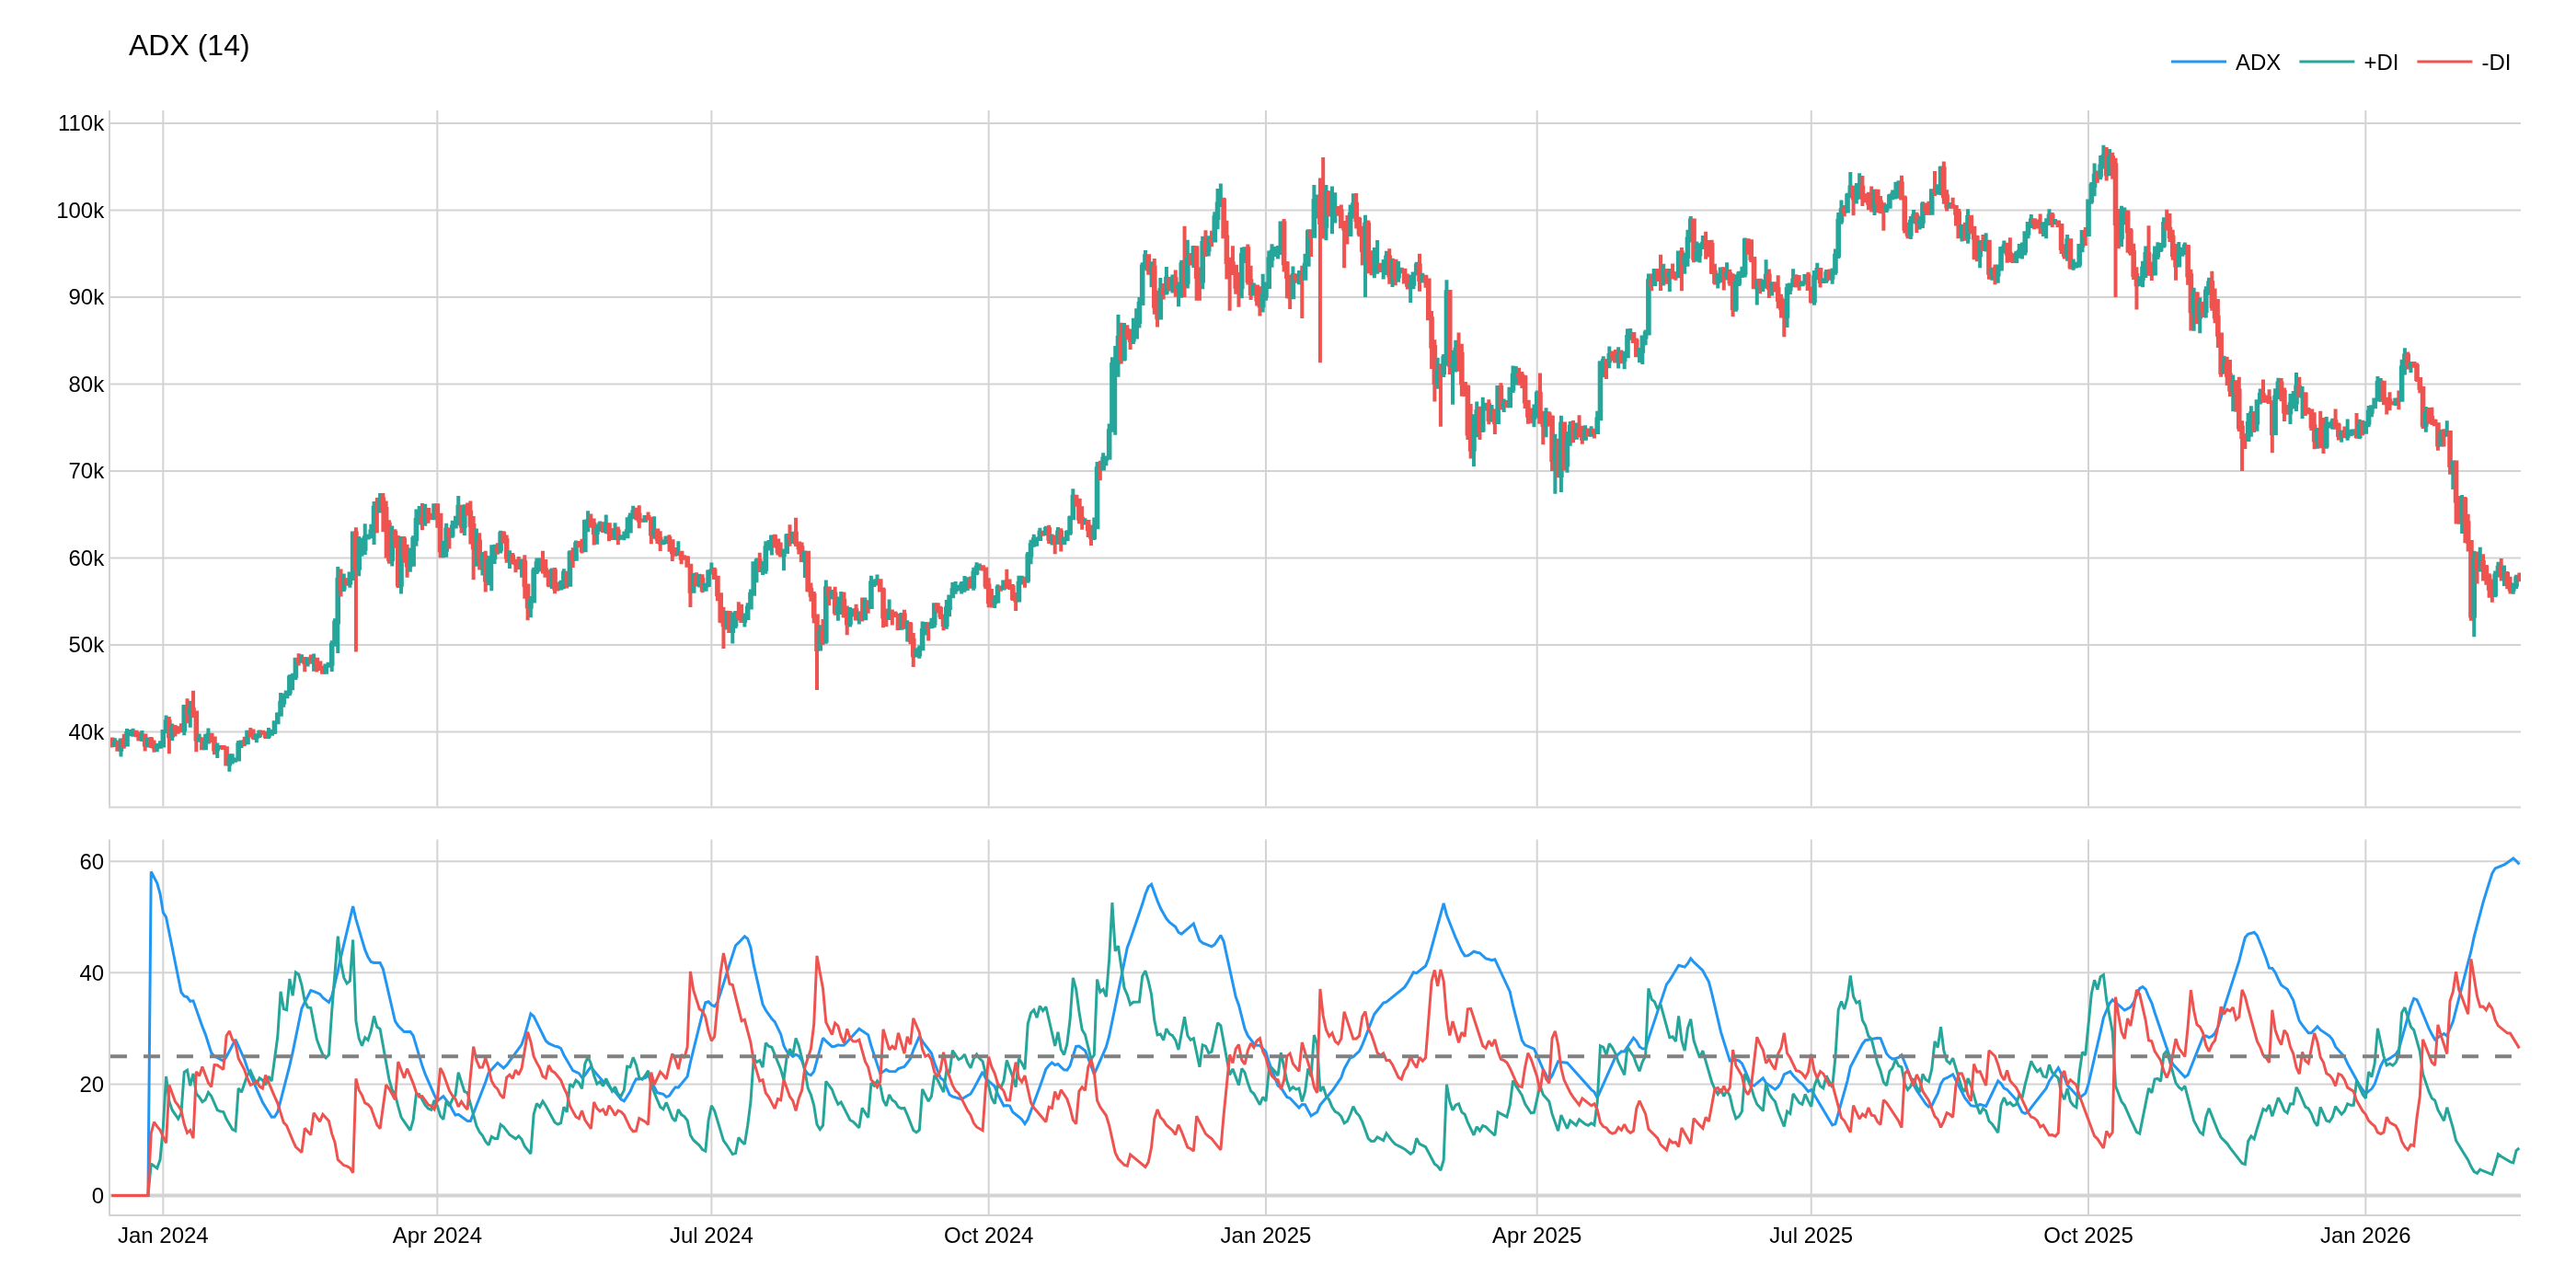
The image above uses the following parameters:
| Parameter | Value |
|---|---|
period | 14 |