Williams %R
Warmup Window
Minimum bars needed: period bars
(default params: 14 bars (period=14))
Needs period bars to establish the highest-high and lowest-low window. After warmup, the indicator updates in real-time.
✅ After the warmup window is filled, this indicator produces a new value on every incoming bar in real-time.
Lagging Indicator
Williams %R readings lag behind price extremes.
| Event | Lag | Detail |
|---|---|---|
| Oscillator reaches overbought (>−20) / oversold (<−80) | ≈ period / 2 bars | Rolling highest-high / lowest-low over the specified period |
| Oscillator crosses −50 midline | ≈ period / 2 bars | Same rolling window applies |
Formula for custom params: lag ≈ period / 2
Williams %R (Williams Percent Range) is a momentum indicator used in technical analysis to measure overbought and oversold conditions in a market. It moves between 0 and -100 and helps traders identify potential reversal points.
def willr(
    data: Union[pd.DataFrame, pl.DataFrame],
    period: int = 14,
    result_column: str = None,
    high_column: str = "High",
    low_column: str = "Low",
    close_column: str = "Close"
) -> Union[pd.DataFrame, pl.DataFrame]:
Example
from investing_algorithm_framework import download

from pyindicators import willr

pl_df = download(
    symbol="btc/eur",
    market="binance",
    time_frame="1d",
    start_date="2023-12-01",
    end_date="2023-12-25",
    save=True,
    storage_path="./data"
)
pd_df = download(
    symbol="btc/eur",
    market="binance",
    time_frame="1d",
    start_date="2023-12-01",
    end_date="2023-12-25",
    pandas=True,
    save=True,
    storage_path="./data"
)

pl_df = data_source.get_data()
pd_df = data_source.get_data(pandas=True)

# Calculate Williams%R for Polars DataFrame
pl_df = willr(pl_df, result_column="WILLR")
pl_df.show(10)

# Calculate Williams%R for Pandas DataFrame
pd_df = willr(pd_df, result_column="WILLR")
pd_df.tail(10)
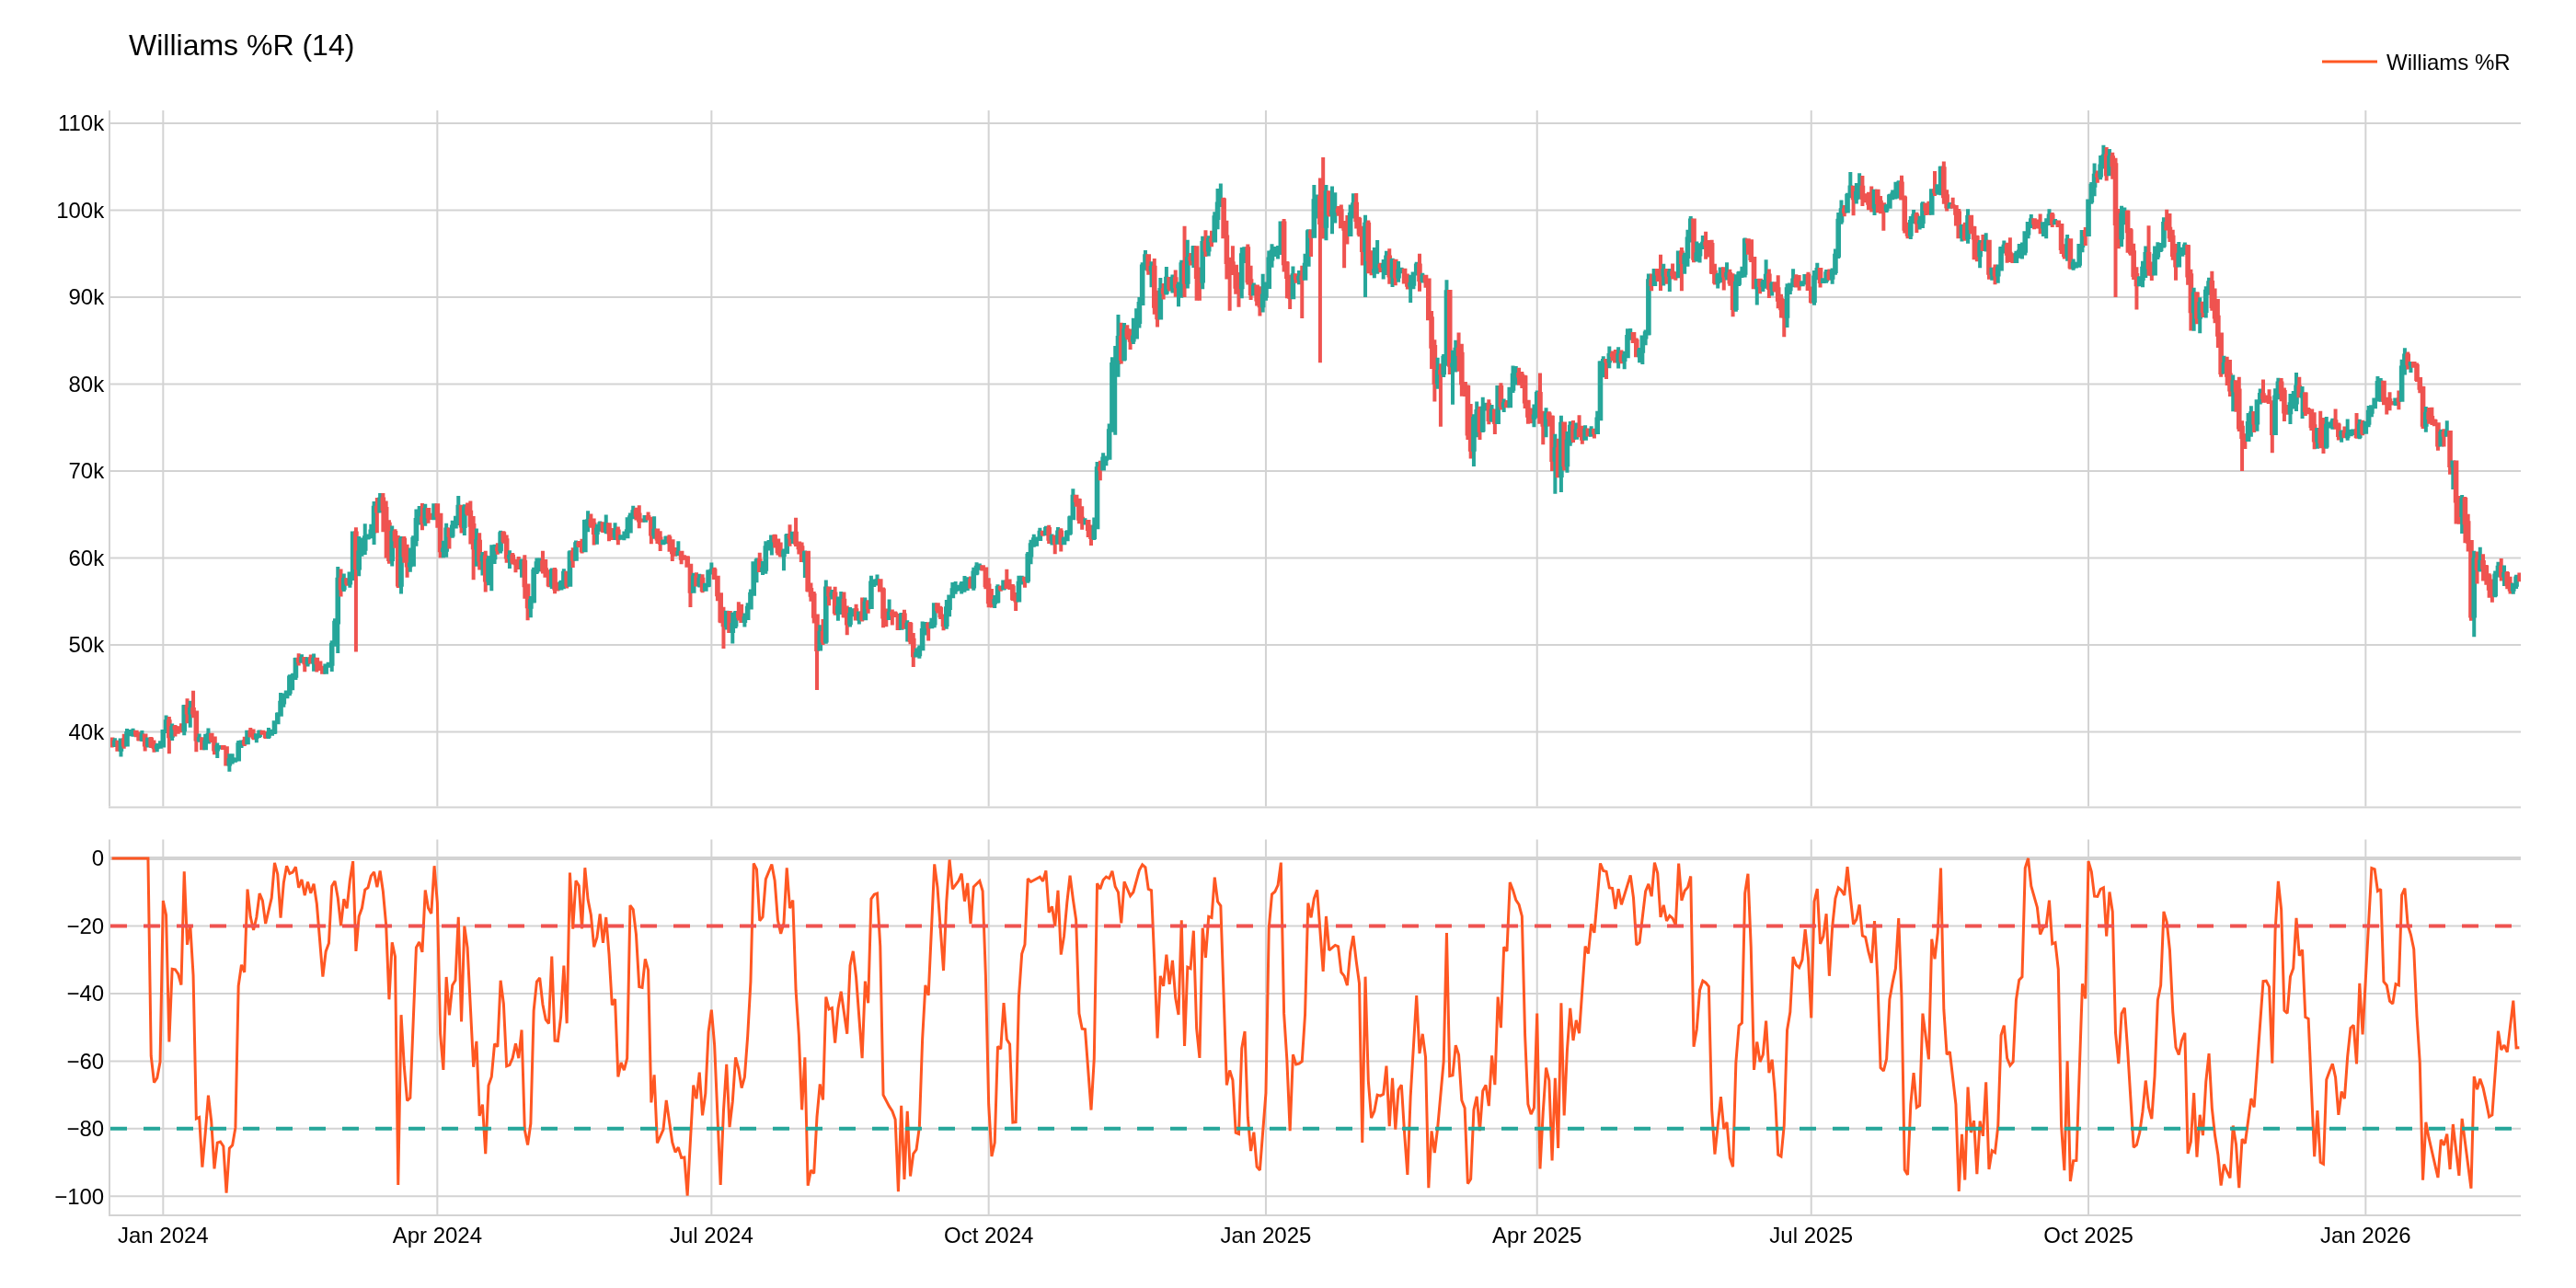
Chart Parameters
The image above uses the following parameters:
| Parameter | Value |
|---|---|
period | 14 |