Moving Average Convergence Divergence (MACD)
Minimum bars needed: long_period + signal_period bars
(default params: 35 bars (long_period=26, signal_period=9))
The slow EMA needs long_period bars, then the signal line EMA needs signal_period additional bars on top. After warmup, all MACD components update in real-time.
✅ After the warmup window is filled, this indicator produces a new value on every incoming bar in real-time.
MACD line, histogram, and signal line all lag behind price moves.
| Event | Lag | Detail |
|---|---|---|
| MACD line crosses zero (trend change) | ≈ long_period / 2 bars | Dominated by the slow EMA |
| MACD histogram changes sign | ≈ long_period / 2 bars | Histogram = MACD − Signal; inherits MACD lag |
| Signal line crossover (buy/sell trigger) | ≈ long_period / 2 + signal_period / 2 bars | Signal is EMA of MACD; adds extra smoothing on top of MACD lag |
Formula for custom params: MACD ≈ long_period / 2; signal ≈ long_period / 2 + signal_period / 2
The Moving Average Convergence Divergence (MACD) is used to identify trend direction, strength, and potential reversals. It is based on the relationship between two Exponential Moving Averages (EMAs) and includes a histogram to visualize momentum.
def macd(
    data: Union[PdDataFrame, PlDataFrame],
    source_column: str,
    short_period: int = 12,
    long_period: int = 26,
    signal_period: int = 9,
    macd_column: str = "macd",
    signal_column: str = "macd_signal",
    histogram_column: str = "macd_histogram"
) -> Union[PdDataFrame, PlDataFrame]:
Example
from investing_algorithm_framework import download

from pyindicators import macd

pl_df = download(
    symbol="btc/eur",
    market="binance",
    time_frame="1d",
    start_date="2023-12-01",
    end_date="2023-12-25",
    save=True,
    storage_path="./data"
)
pd_df = download(
    symbol="btc/eur",
    market="binance",
    time_frame="1d",
    start_date="2023-12-01",
    end_date="2023-12-25",
    pandas=True,
    save=True,
    storage_path="./data"
)

# Calculate MACD for Polars DataFrame
pl_df = macd(pl_df, source_column="Close", short_period=12, long_period=26, signal_period=9)

# Calculate MACD for Pandas DataFrame
pd_df = macd(pd_df, source_column="Close", short_period=12, long_period=26, signal_period=9)

pl_df.show(10)
pd_df.tail(10)
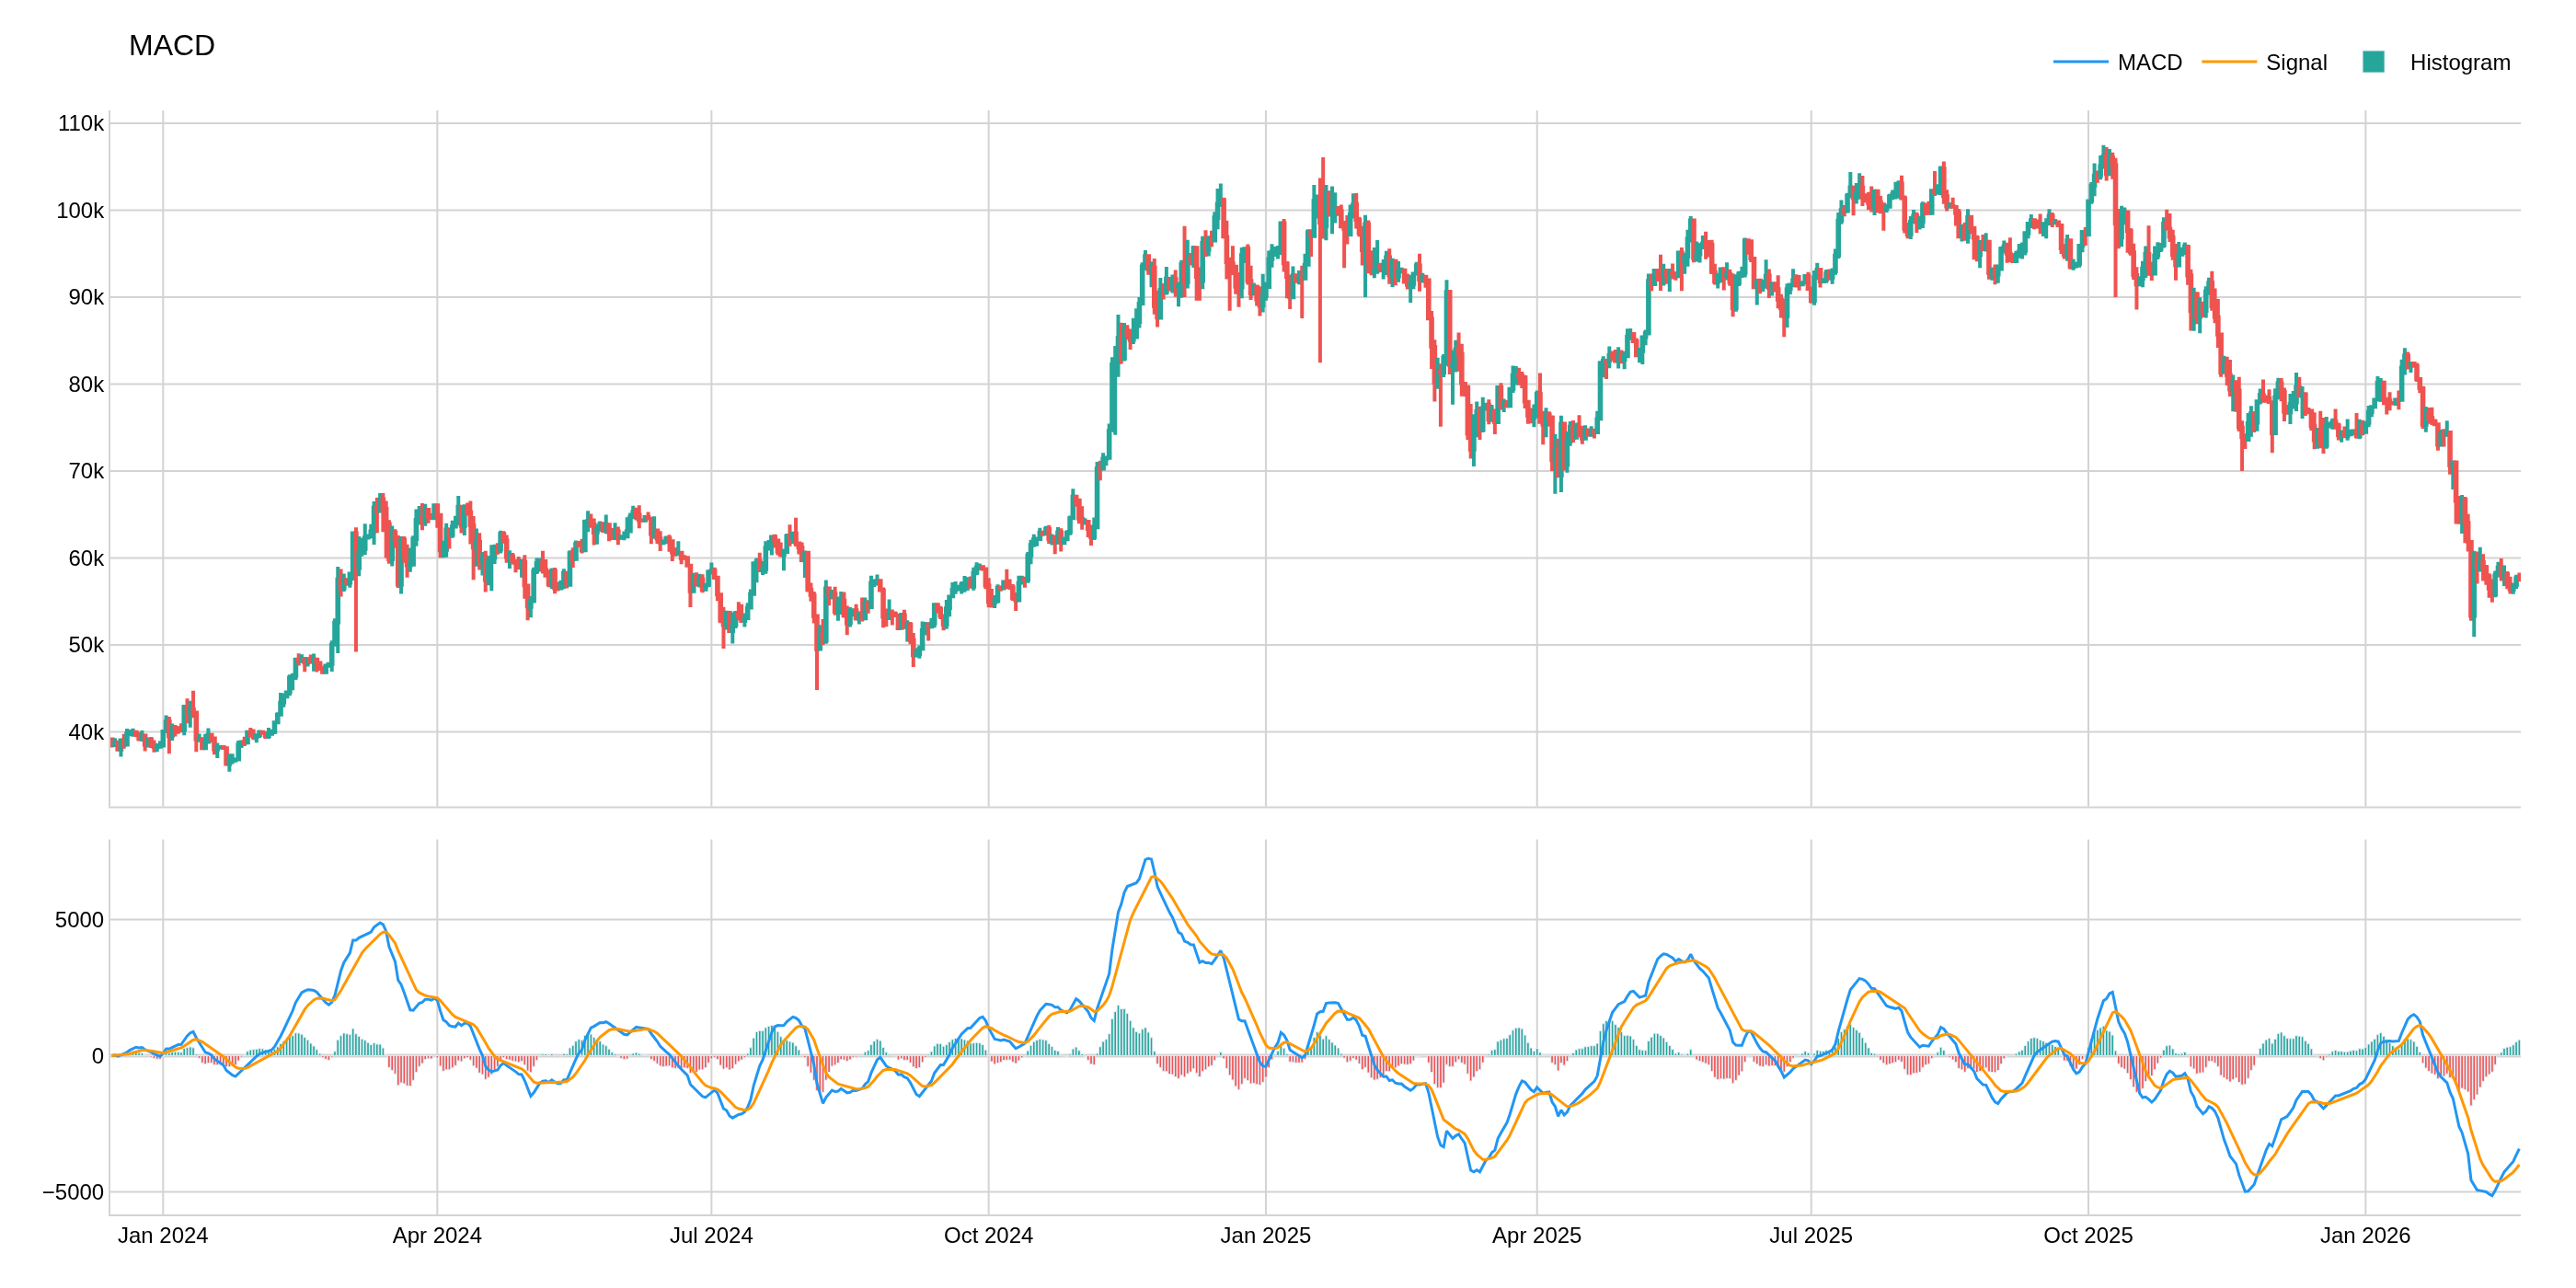
The image above uses the following parameters:
| Parameter | Value |
|---|---|
source_column | Close |
short_period | 12 |
long_period | 26 |
signal_period | 9 |