Relative Strength Index (RSI)
Warmup Window
Minimum bars needed: period bars
(default params: 14 bars (period=14))
RSI needs period bars to compute the initial average gain/loss. After the warmup, RSI updates in real-time on every new bar.
✅ After the warmup window is filled, this indicator produces a new value on every incoming bar in real-time.
Lagging Indicator
RSI readings lag behind the actual momentum shift in price.
| Event | Lag | Detail |
|---|---|---|
| RSI reaches overbought (>70) / oversold (<30) | ≈ period bars | Rolling mean of gains/losses over the specified period |
| RSI crosses 50 (trend confirmation) | ≈ period bars | Same smoothing window applies |
Formula for custom params: lag ≈ period
The Relative Strength Index (RSI) is a momentum oscillator that measures the speed and change of price movements. It moves between 0 and 100 and is used to identify overbought or oversold conditions in a market.
def rsi(
    data: Union[pd.DataFrame, pl.DataFrame],
    source_column: str,
    period: int = 14,
    result_column: str = None,
) -> Union[pd.DataFrame, pl.DataFrame]:
Example
from investing_algorithm_framework import download

from pyindicators import rsi

pl_df = download(
    symbol="btc/eur",
    market="binance",
    time_frame="1d",
    start_date="2023-12-01",
    end_date="2023-12-25",
    save=True,
    storage_path="./data"
)
pd_df = download(
    symbol="btc/eur",
    market="binance",
    time_frame="1d",
    start_date="2023-12-01",
    end_date="2023-12-25",
    pandas=True,
    save=True,
    storage_path="./data"
)

# Calculate RSI for Polars DataFrame
pl_df = rsi(pl_df, source_column="Close", period=14, result_column="RSI_14")
pl_df.show(10)

# Calculate RSI for Pandas DataFrame
pd_df = rsi(pd_df, source_column="Close", period=14, result_column="RSI_14")
pd_df.tail(10)
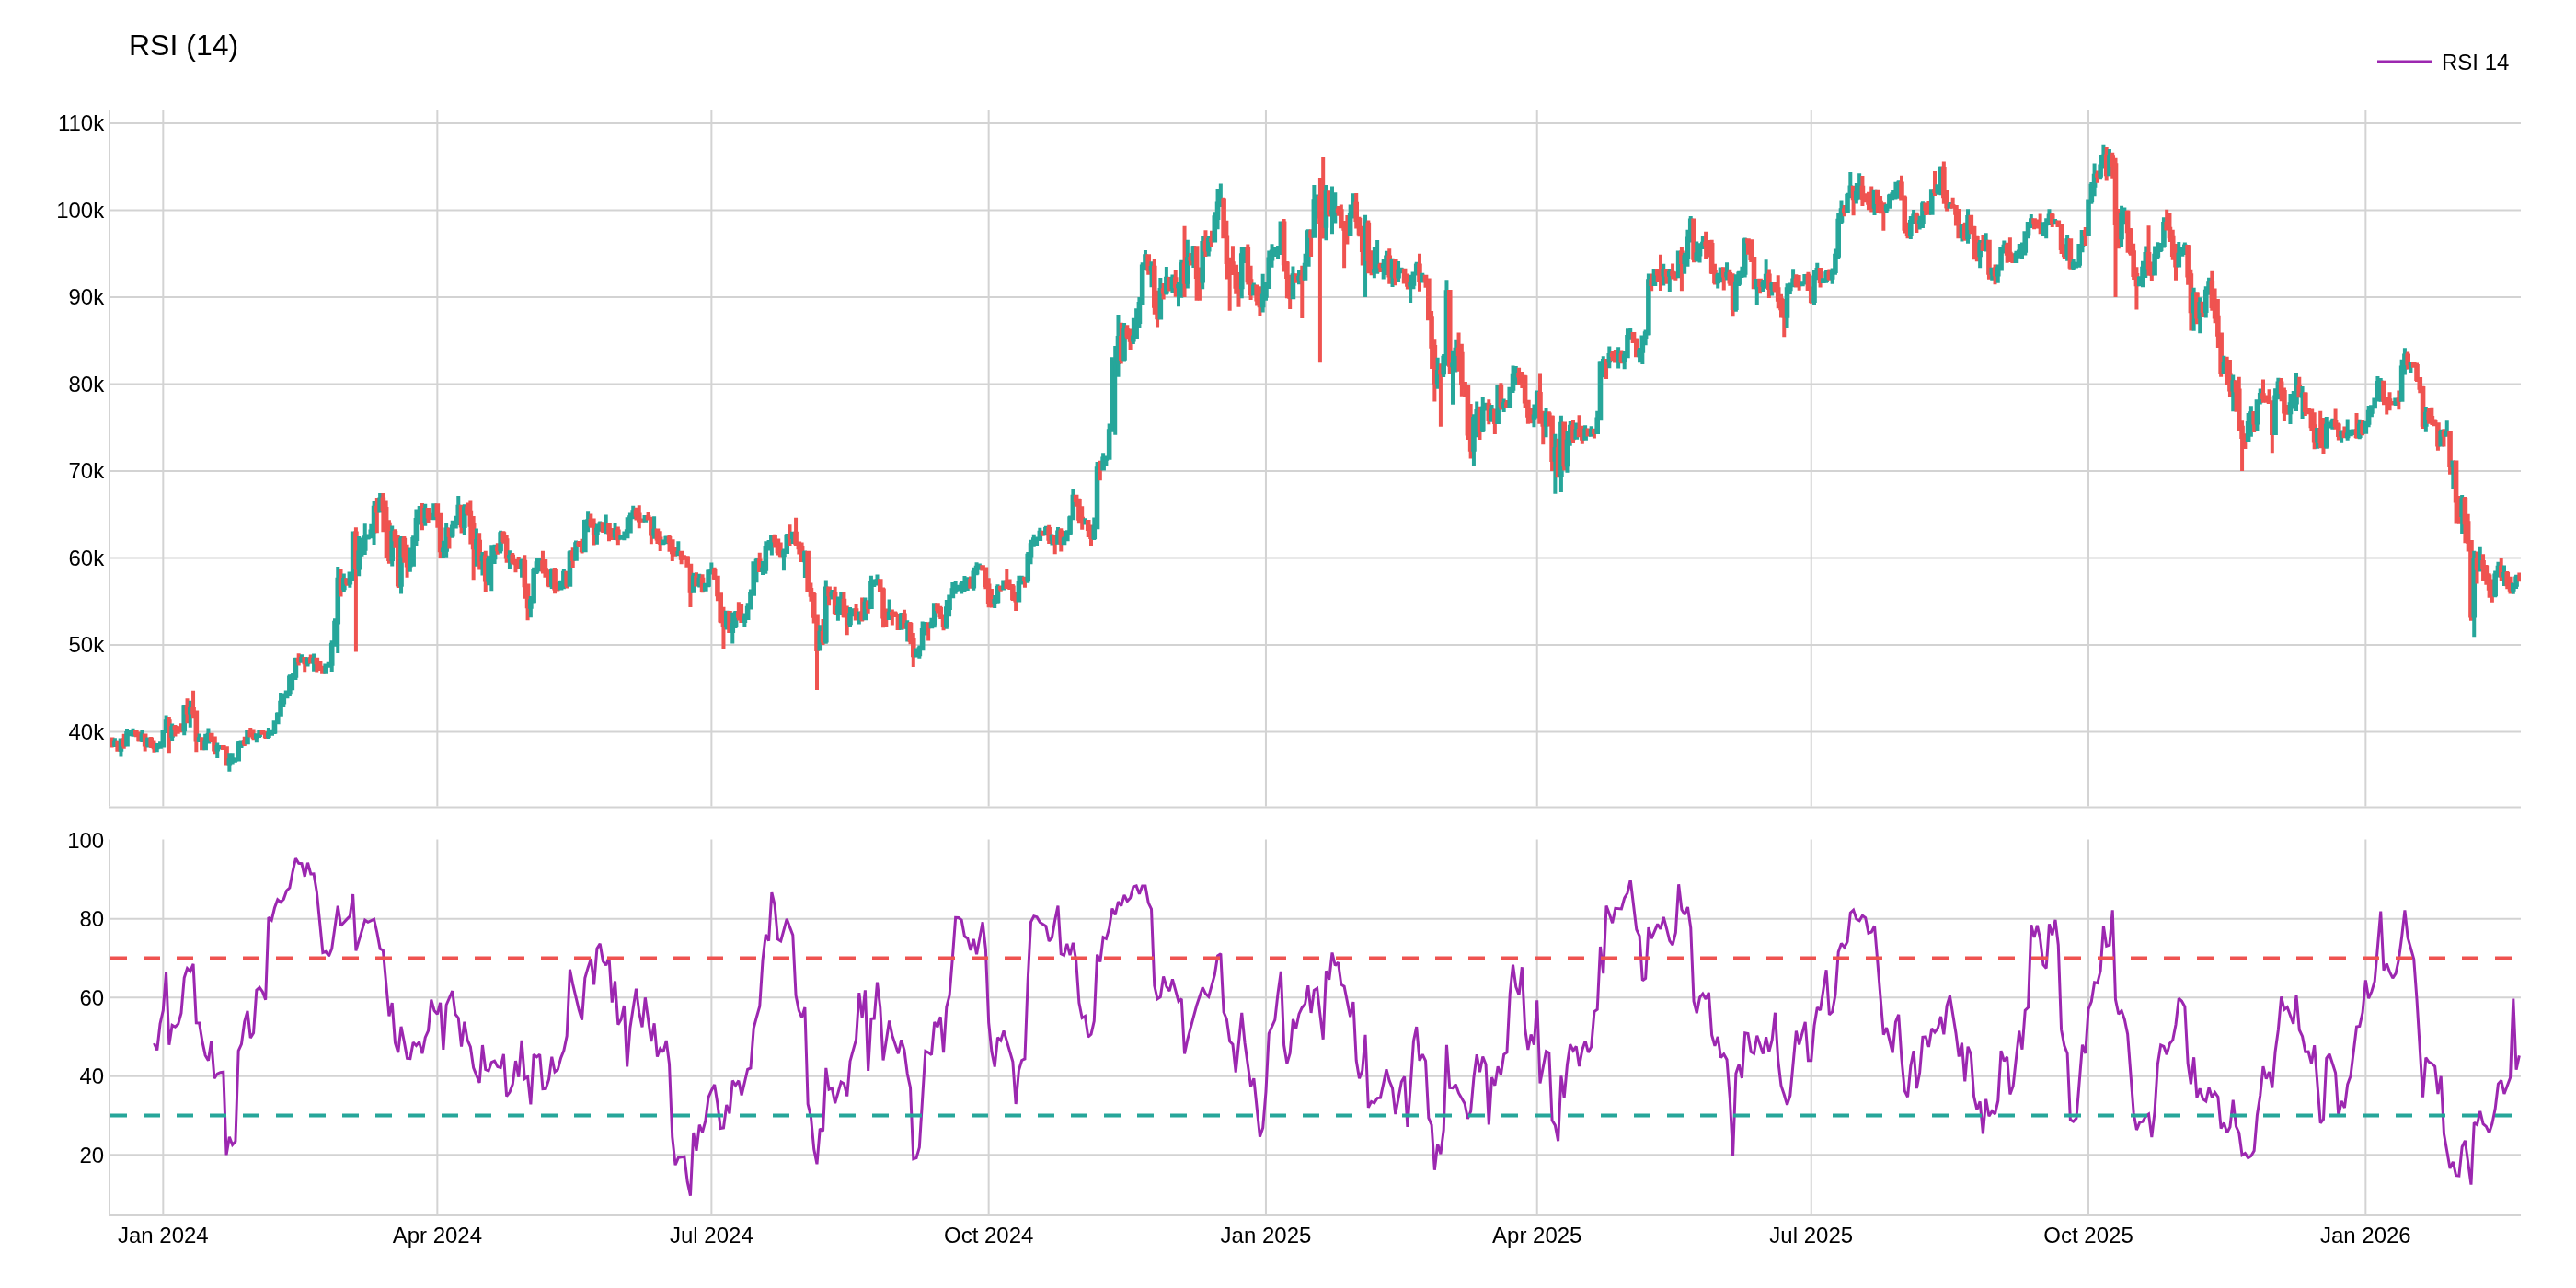
Chart Parameters
The image above uses the following parameters:
| Parameter | Value |
|---|---|
source_column | Close |
period | 14 |