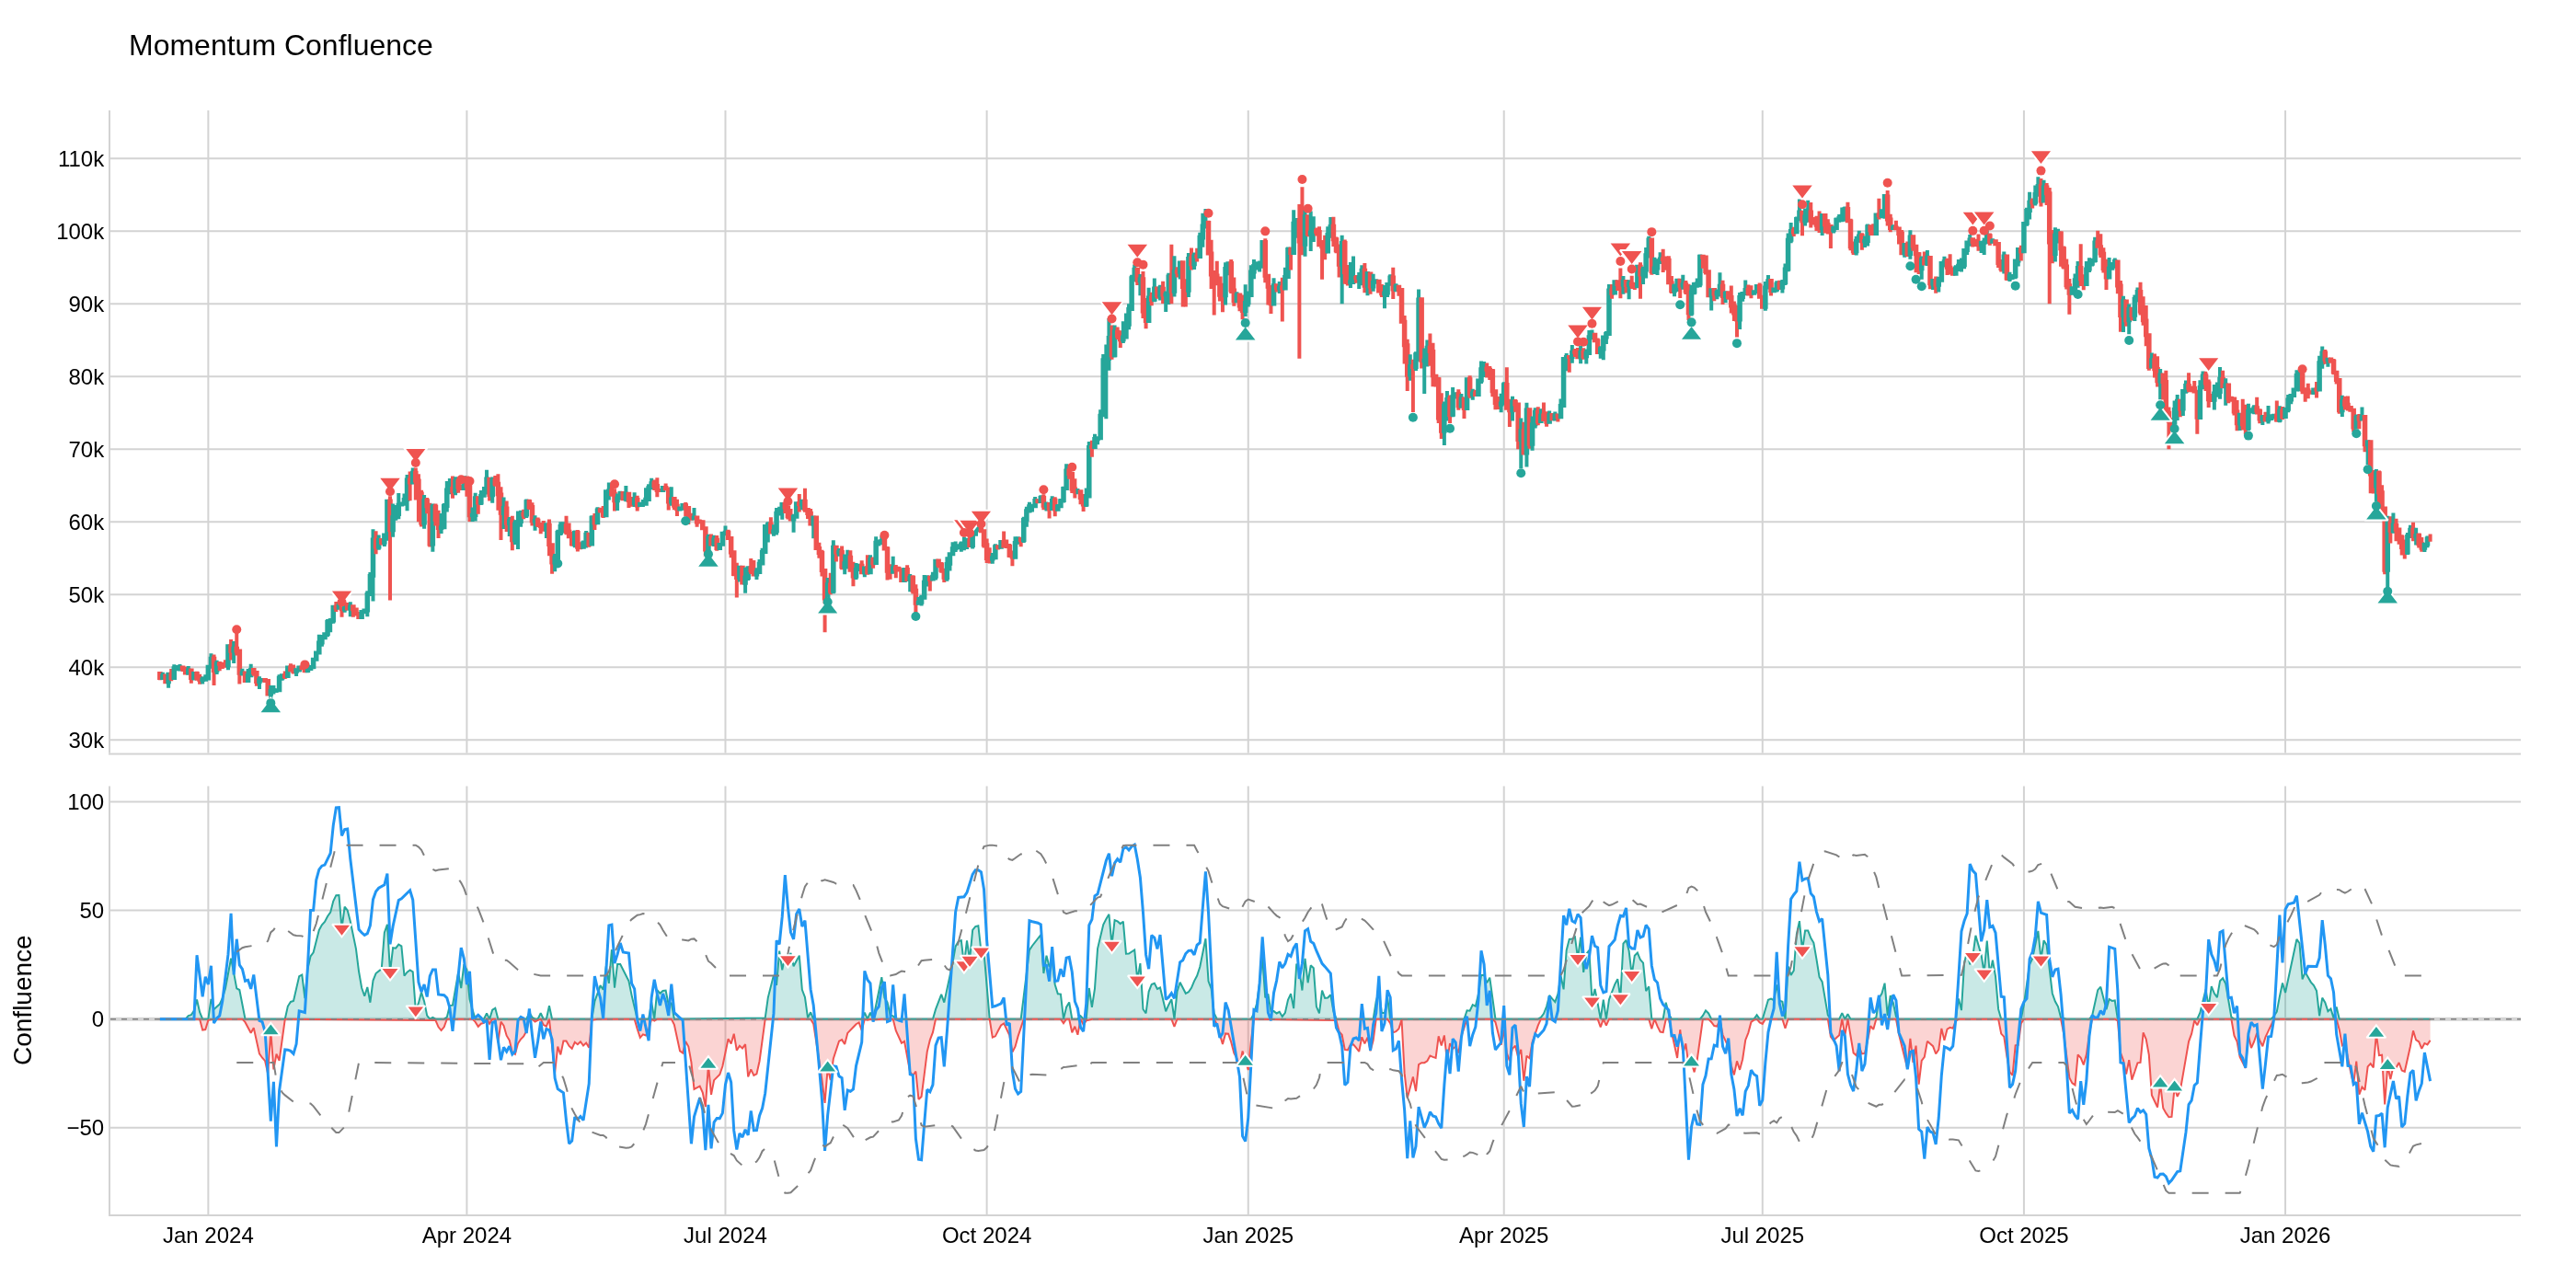
Momentum Confluence
Minimum bars needed: max(money_flow_length, trend_wave_length) bars
(default params: 14 bars (money_flow_length=14))
The warmup is determined by the slowest sub-indicator (RSI, Stochastic, or money flow). After warmup, the composite score updates in real-time.
✅ After the warmup window is filled, this indicator produces a new value on every incoming bar in real-time.
Confluence score and reversal signals lag behind the actual momentum shift.
| Event | Lag | Detail |
|---|---|---|
| Confluence crosses zero (trend change) | ≈ max(money_flow_length, trend_wave_length) bars | Composite of RSI, Stochastic, and EMA components; dominated by the slowest |
| Strong reversal signal fires | ≈ max(money_flow_length, trend_wave_length) bars | Requires multiple sub-indicators to agree |
| Money flow crosses threshold | ≈ money_flow_length bars | Money flow uses its own smoothing period |
Formula for custom params: lag ≈ max(money_flow_length, trend_wave_length)
Momentum Confluence is a comprehensive multi-component oscillator that combines multiple technical analysis components to provide a powerful trend following and reversal detection system.
Components:
- Money Flow: Measures buying/selling liquidity entering the market (-100 to +100)
- Thresholds: Dynamic levels showing significant buying/selling activity
- Overflow: Detects excess buying/selling that predicts reversals
- Trend Wave: A highly reactive trend-following oscillator (0-100)
- Real-Time Divergences: Price vs oscillator divergence detection
- Reversal Signals: High-frequency (small dots) and strong (arrows) reversal signals
- Confluence: Combined signal strength from all components (-100 to +100)
def momentum_confluence(
    data: Union[PdDataFrame, PlDataFrame],
    money_flow_length: int = 14,
    trend_wave_length: int = 10,
    threshold_mult: float = 1.5,
    overflow_threshold: float = 0.8,
    divergence_lookback: int = 5,
    high_column: str = 'High',
    low_column: str = 'Low',
    close_column: str = 'Close',
    volume_column: str = 'Volume',
    ...
) -> Union[PdDataFrame, PlDataFrame]:
Example
from pyindicators import (
    momentum_confluence,
    momentum_confluence_signal,
    get_momentum_confluence_stats
)

# Calculate Momentum Confluence
df = momentum_confluence(df)

# Generate trading signals
df = momentum_confluence_signal(df)

# Get statistics
stats = get_momentum_confluence_stats(df)
print(f"Strong bullish reversals: {stats['strong_reversal_bullish_count']}")
print(f"Divergences detected: {stats['divergence_bullish_count']}")
Output Columns:
money_flow: Money flow oscillator (-100 to +100)mf_upper_threshold/mf_lower_threshold: Dynamic threshold levelsoverflow_bullish/overflow_bearish: Excess buying/selling (0 or 1)trend_wave: Trend oscillator (0-100)trend_wave_signal: Trend direction (1=bullish, -1=bearish, 0=neutral)divergence_bullish/divergence_bearish: Divergence detection (0 or 1)reversal_bullish/reversal_bearish: High-frequency reversal signals (0 or 1)reversal_strong_bullish/reversal_strong_bearish: Strong reversal signals (0 or 1)confluence: Combined signal strength (-100 to +100)mc_trend: Overall trend direction (1=bullish, -1=bearish, 0=neutral)
Signal Values (from momentum_confluence_signal):
2: Strong bullish reversal signal1: Bullish confluence0: Neutral-1: Bearish confluence-2: Strong bearish reversal signal
Volatility indicators
Indicators that measure the rate of price movement, regardless of direction. They help to identify periods of high and low volatility in the market.