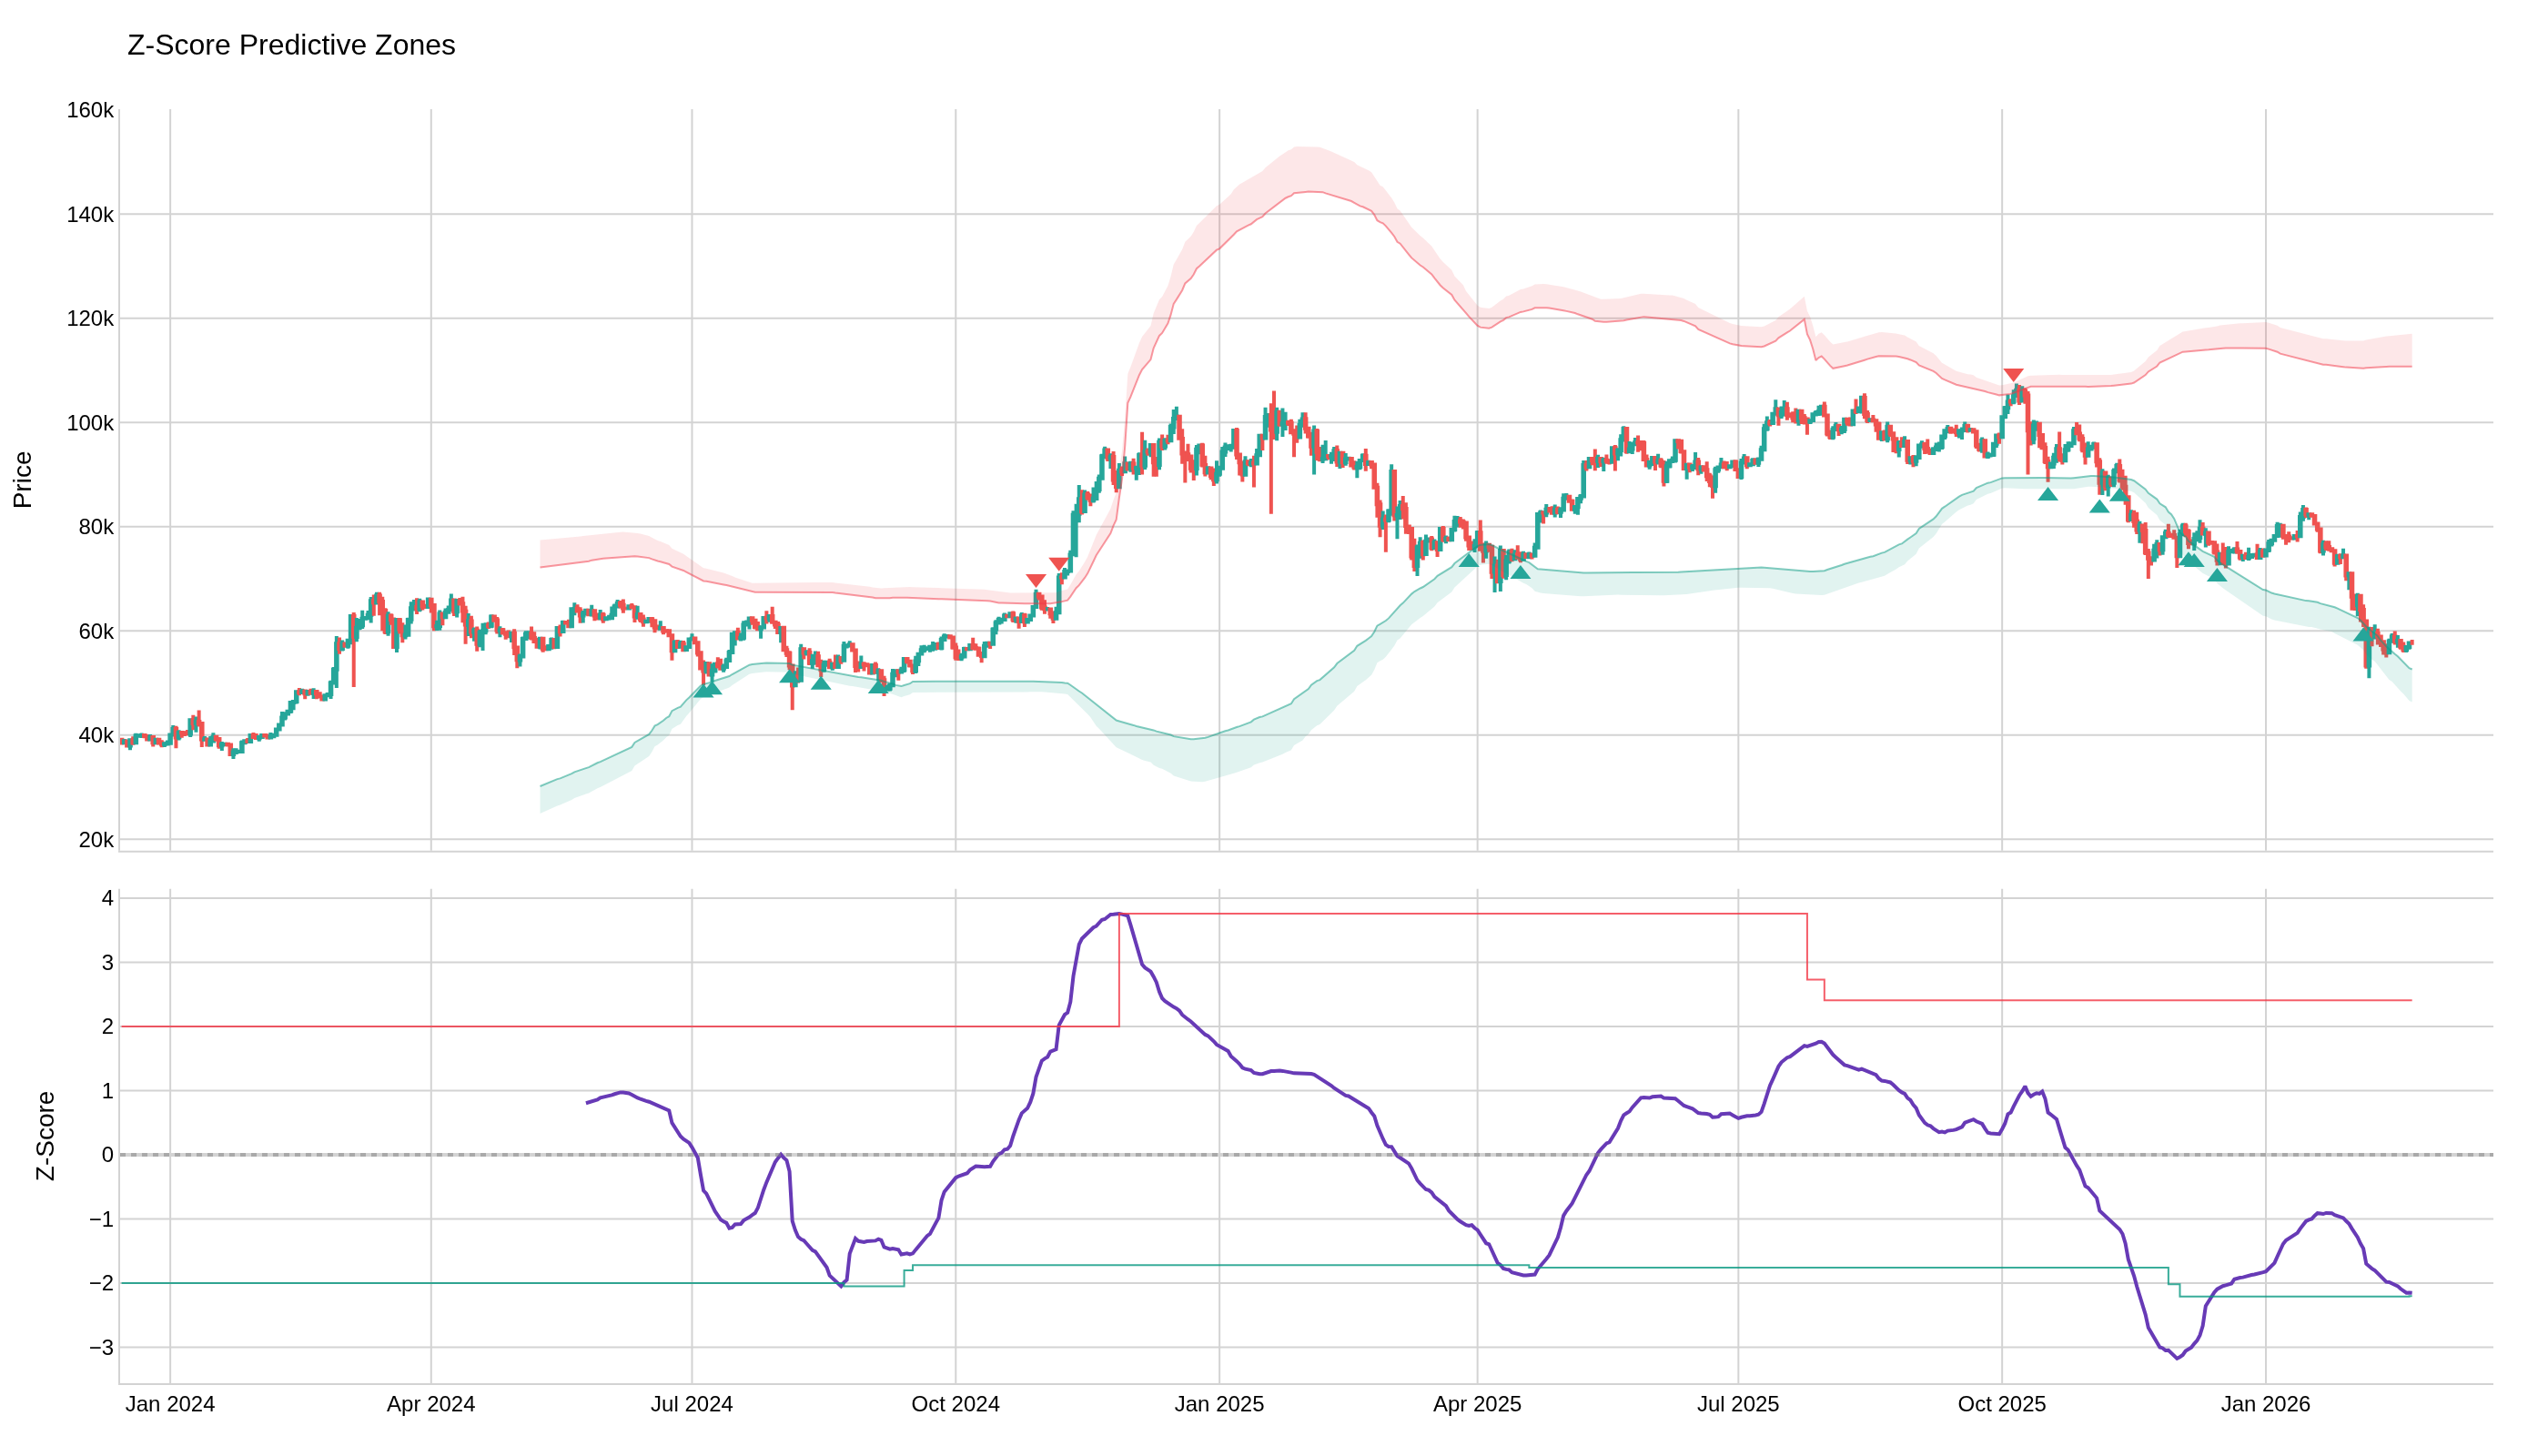
Z-Score Predictive Zones
Lagging Indicator
Z-Score smoothing and dynamic reversal levels introduce lag relative to the actual reversal.
| Event | Lag | Detail |
|---|---|---|
| Z-Score crosses dynamic reversal level | ≈ 20 bars | VWMA smoothing on the raw Z-Score (default smooth=20) |
| Price band boundaries shift | ≈ 4 bars | VWMA smoothing on the price bands (default band_smooth=4) |
| RSI gradient updates | ≈ 14 bars | RSI period (default rsi_length=14) with 9-period EMA |
Formula for custom params: lag ≈ smooth (dominant smoothing parameter)
Z-Score Predictive Zones detects statistical extremes in price by computing a VWMA-smoothed Z-Score, then tracking pivot-high and pivot-low reversals to build dynamic resistance and support levels. When the Z-Score crosses these levels, price bands are reverse-engineered back into price space, providing clear overbought/oversold zones on the chart.
How it works:
- Compute raw Z-Score:
(Close - SMA) / StdDevoverz_lengthbars - Smooth via Volume-Weighted Moving Average (VWMA)
- Detect pivot highs/lows and filter by
threshold - Track rolling average of recent reversal Z-Score levels
- Map Z-Score levels back to price using
mean ± level × std - Apply VWMA smoothing to produce resistance and support bands
- Generate long/short signals on band crossovers
def z_score_predictive_zones(
    data: Union[PdDataFrame, PlDataFrame],
    z_length: int = 144,
    smooth: int = 20,
    history_depth: int = 25,
    threshold: float = 1.5,
    rsi_length: int = 14,
    rsi_ma_length: int = 9,
    band_smooth: int = 4,
    atr_length: int = 30,
    high_column: str = 'High',
    low_column: str = 'Low',
    close_column: str = 'Close',
    volume_column: str = 'Volume',
) -> Union[PdDataFrame, PlDataFrame]:
Example
from pyindicators import (
    z_score_predictive_zones,
    z_score_predictive_zones_signal,
    get_z_score_predictive_zones_stats,
)

# Calculate Z-Score Predictive Zones
df = z_score_predictive_zones(df)

# Generate trading signals (already computed, returned for API consistency)
df = z_score_predictive_zones_signal(df)

# Get statistics
stats = get_z_score_predictive_zones_stats(df)
print(f"Long signals: {stats['long_signals']}")
print(f"Short signals: {stats['short_signals']}")
Output Columns:
zspz_z_score: VWMA-smoothed Z-Score oscillatorzspz_mean/zspz_std: Rolling SMA and StdDev of closezspz_avg_top_level/zspz_avg_bot_level: Dynamic resistance/support Z-Score levelszspz_res_band_high/zspz_res_band_low: Resistance band in price spacezspz_sup_band_high/zspz_sup_band_low: Support band in price spacezspz_rsi_ma: EMA-smoothed RSI (used for gradient coloring)zspz_long_signal/zspz_short_signal: Binary (0/1) long and short signalszspz_signal: Combined signal (+1 long, -1 short, 0 neutral)
Signal Values (from z_score_predictive_zones_signal):
1: Long signal — price crosses above support band0: Neutral-1: Short signal — price crosses below resistance band