Stochastic Oscillator (STO)
Minimum bars needed: k_period + k_slowing + d_period bars
(default params: 20 bars (k_period=14, k_slowing=3, d_period=3))
The raw %K needs k_period bars, then SMA smoothing adds k_slowing, then %D adds d_period. After warmup, both lines update in real-time.
✅ After the warmup window is filled, this indicator produces a new value on every incoming bar in real-time.
The %K and %D lines lag behind price momentum.
| Event | Lag | Detail |
|---|---|---|
| %K reaches overbought (>80) / oversold (<20) | ≈ k_period / 2 + k_slowing / 2 bars | Rolling HH/LL over k_period, then SMA smoothing with k_slowing |
| %K / %D crossover (buy/sell signal) | ≈ k_period / 2 + k_slowing / 2 + d_period / 2 bars | d_period adds extra smoothing on top of %K |
Formula for custom params: lag ≈ k_period / 2 + k_slowing / 2 (+ d_period / 2 for %D)
The Stochastic Oscillator (STO) is a momentum indicator that compares a particular closing price of an asset to a range of its prices over a certain period. It is used to identify overbought or oversold conditions in a market. The STO consists of two lines: %K and %D, where %K is the main line and %D is the signal line.
def stochastic_oscillator(
    data: Union[pd.DataFrame, pl.DataFrame],
    high_column: str = "High",
    low_column: str = "Low",
    close_column: str = "Close",
    k_period: int = 14,
    k_slowing: int = 3,
    d_period: int = 3,
    result_column: Optional[str] = None
) -> Union[pd.DataFrame, pl.DataFrame]:
Example
from investing_algorithm_framework import download
from pyindicators import stochastic_oscillator
pl_df = download(
    symbol="btc/eur",
    market="binance",
    time_frame="1d",
    start_date="2023-12-01",
    end_date="2023-12-25",
    save=True,
    storage_path="./data"
)
pd_df = download(
    symbol="btc/eur",
    market="binance",
    time_frame="1d",
    start_date="2023-12-01",
    end_date="2023-12-25",
    pandas=True,
    save=True,
    storage_path="./data"
)
# Calculate Stochastic Oscillator for Polars DataFrame
pl_df = stochastic_oscillator(pl_df, high_column="High", low_column="Low", close_column="Close", k_period=14, k_slowing=3, d_period=3, result_column="STO")
pl_df.show(10)
# Calculate Stochastic Oscillator for Pandas DataFrame
pd_df = stochastic_oscillator(pd_df, high_column="High", low_column="Low", close_column="Close", k_period=14, k_slowing=3, d_period=3, result_column="STO")
pd_df.tail(10)
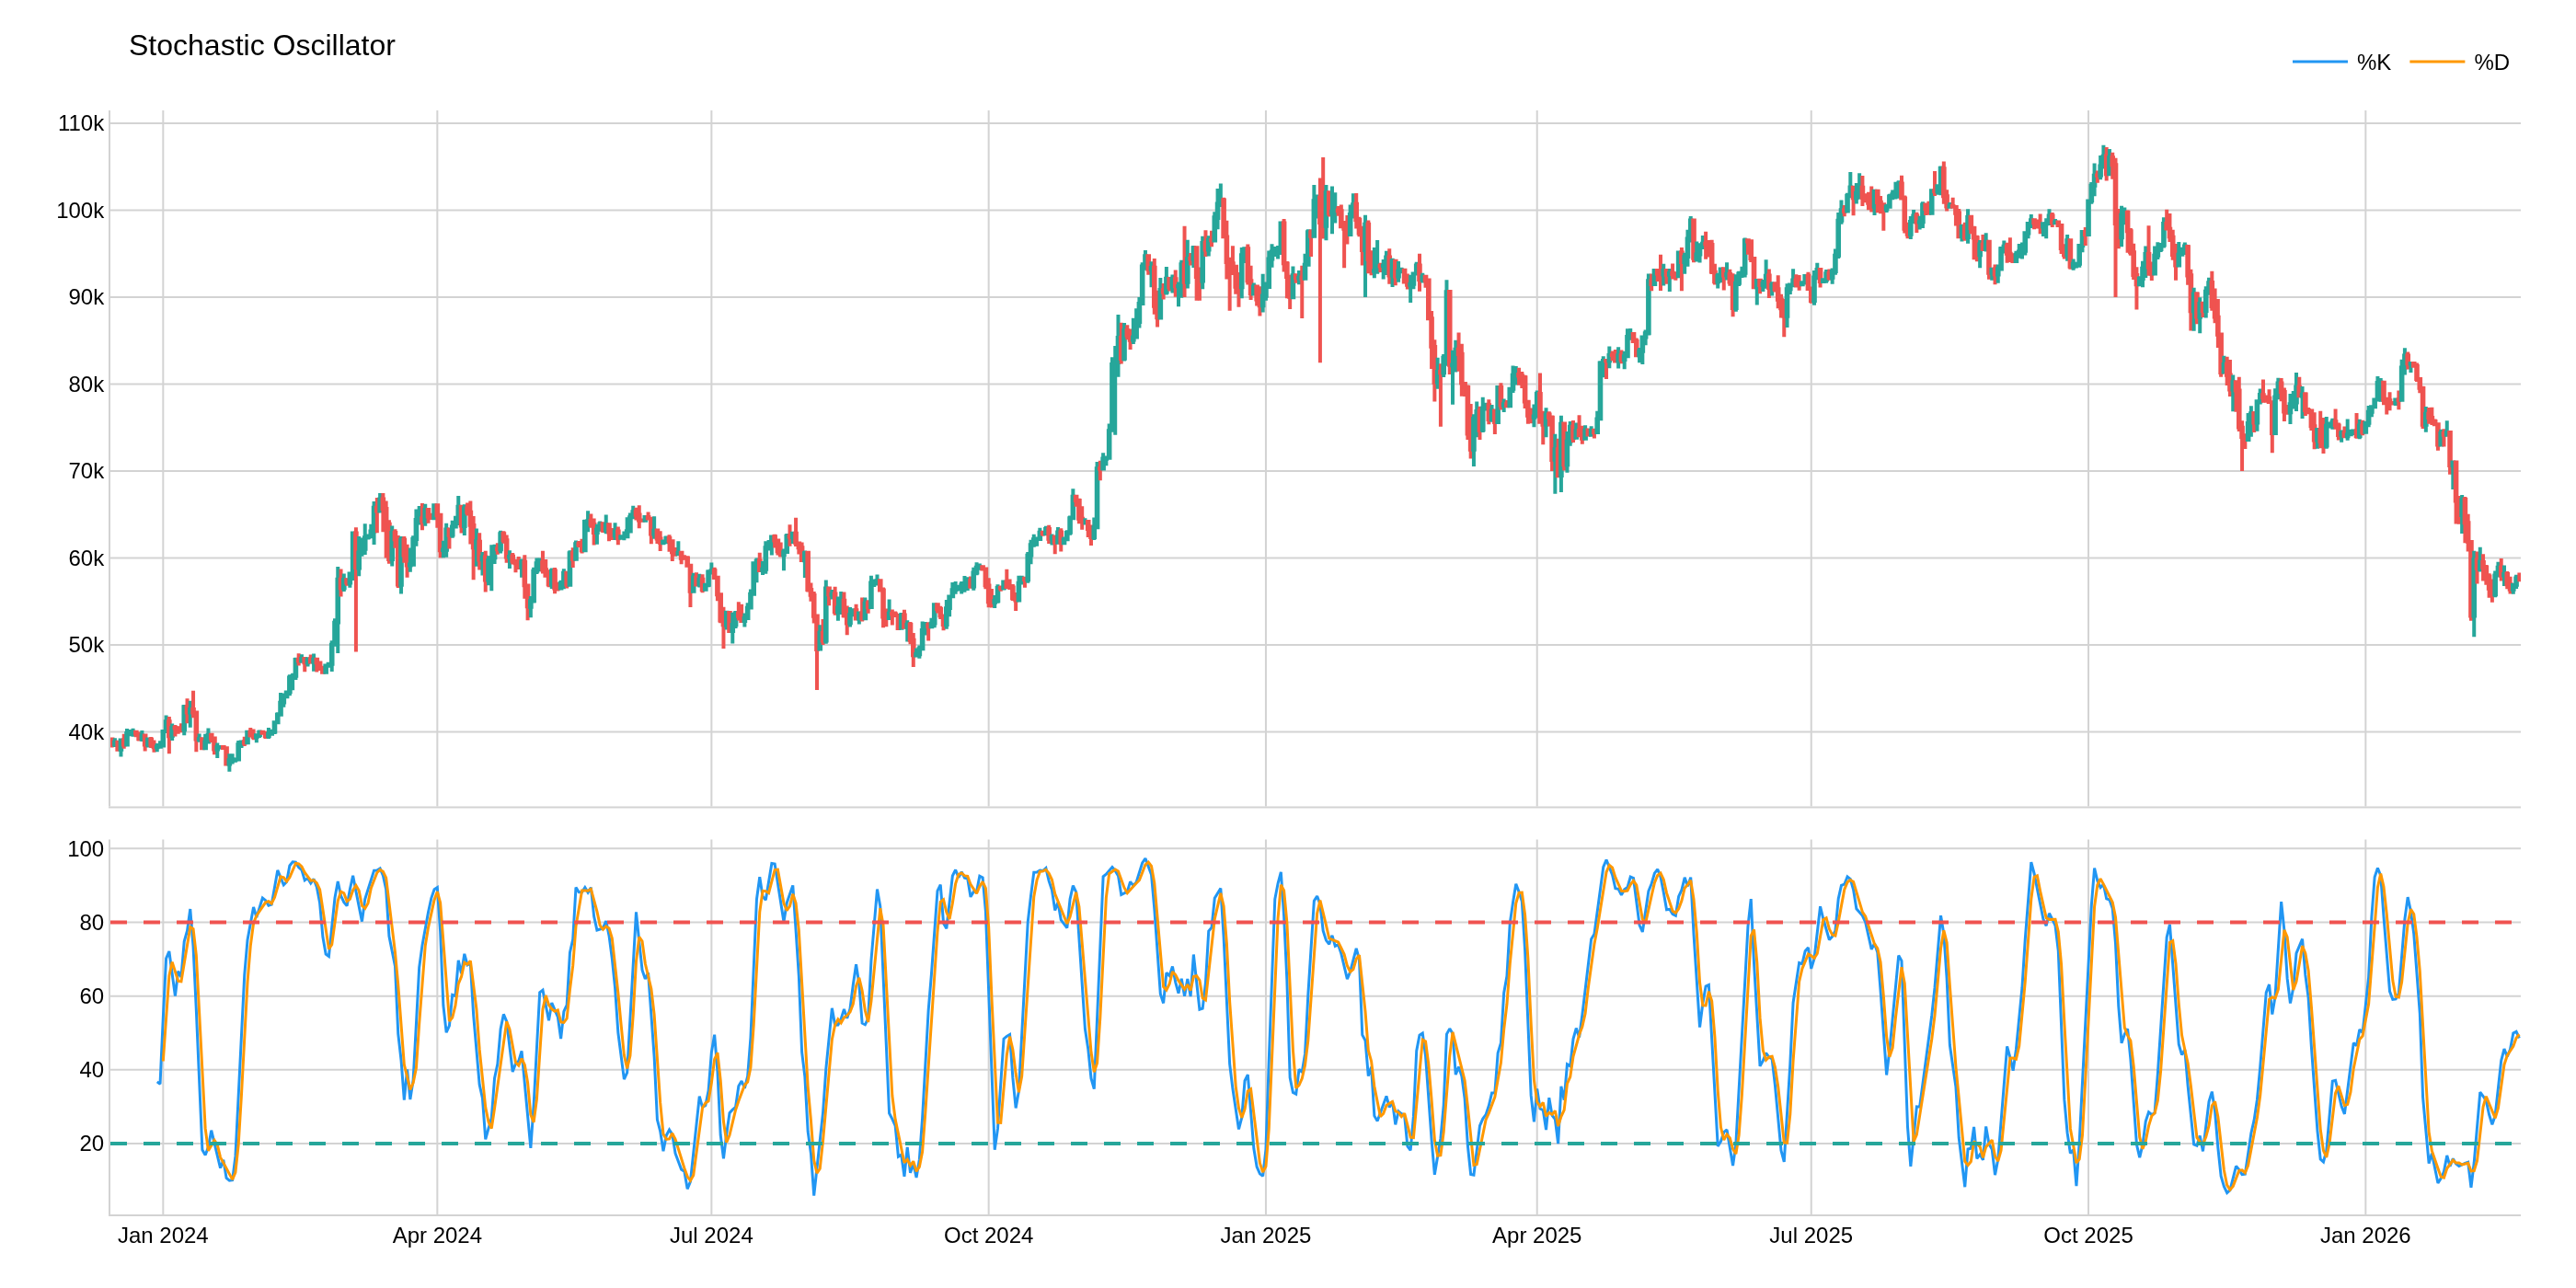
The image above uses the following parameters:
| Parameter | Value |
|---|---|
k_period | 14 |
k_slowing | 3 |
d_period | 3 |