Accumulation & Distribution Zones
Real-time Indicator
Zone detection is triggered when alternating pivot highs and lows form a converging pattern.
| Event | Lag | Detail |
|---|---|---|
| Zone creation | ≈ pivot_length bars | Pivot confirmation requires pivot_length bars on each side (default 5) |
| Pattern match | 0 bars | Checked immediately when a new pivot is confirmed |
Formula for custom params: lag ≈ pivot_length (pivot confirmation delay)
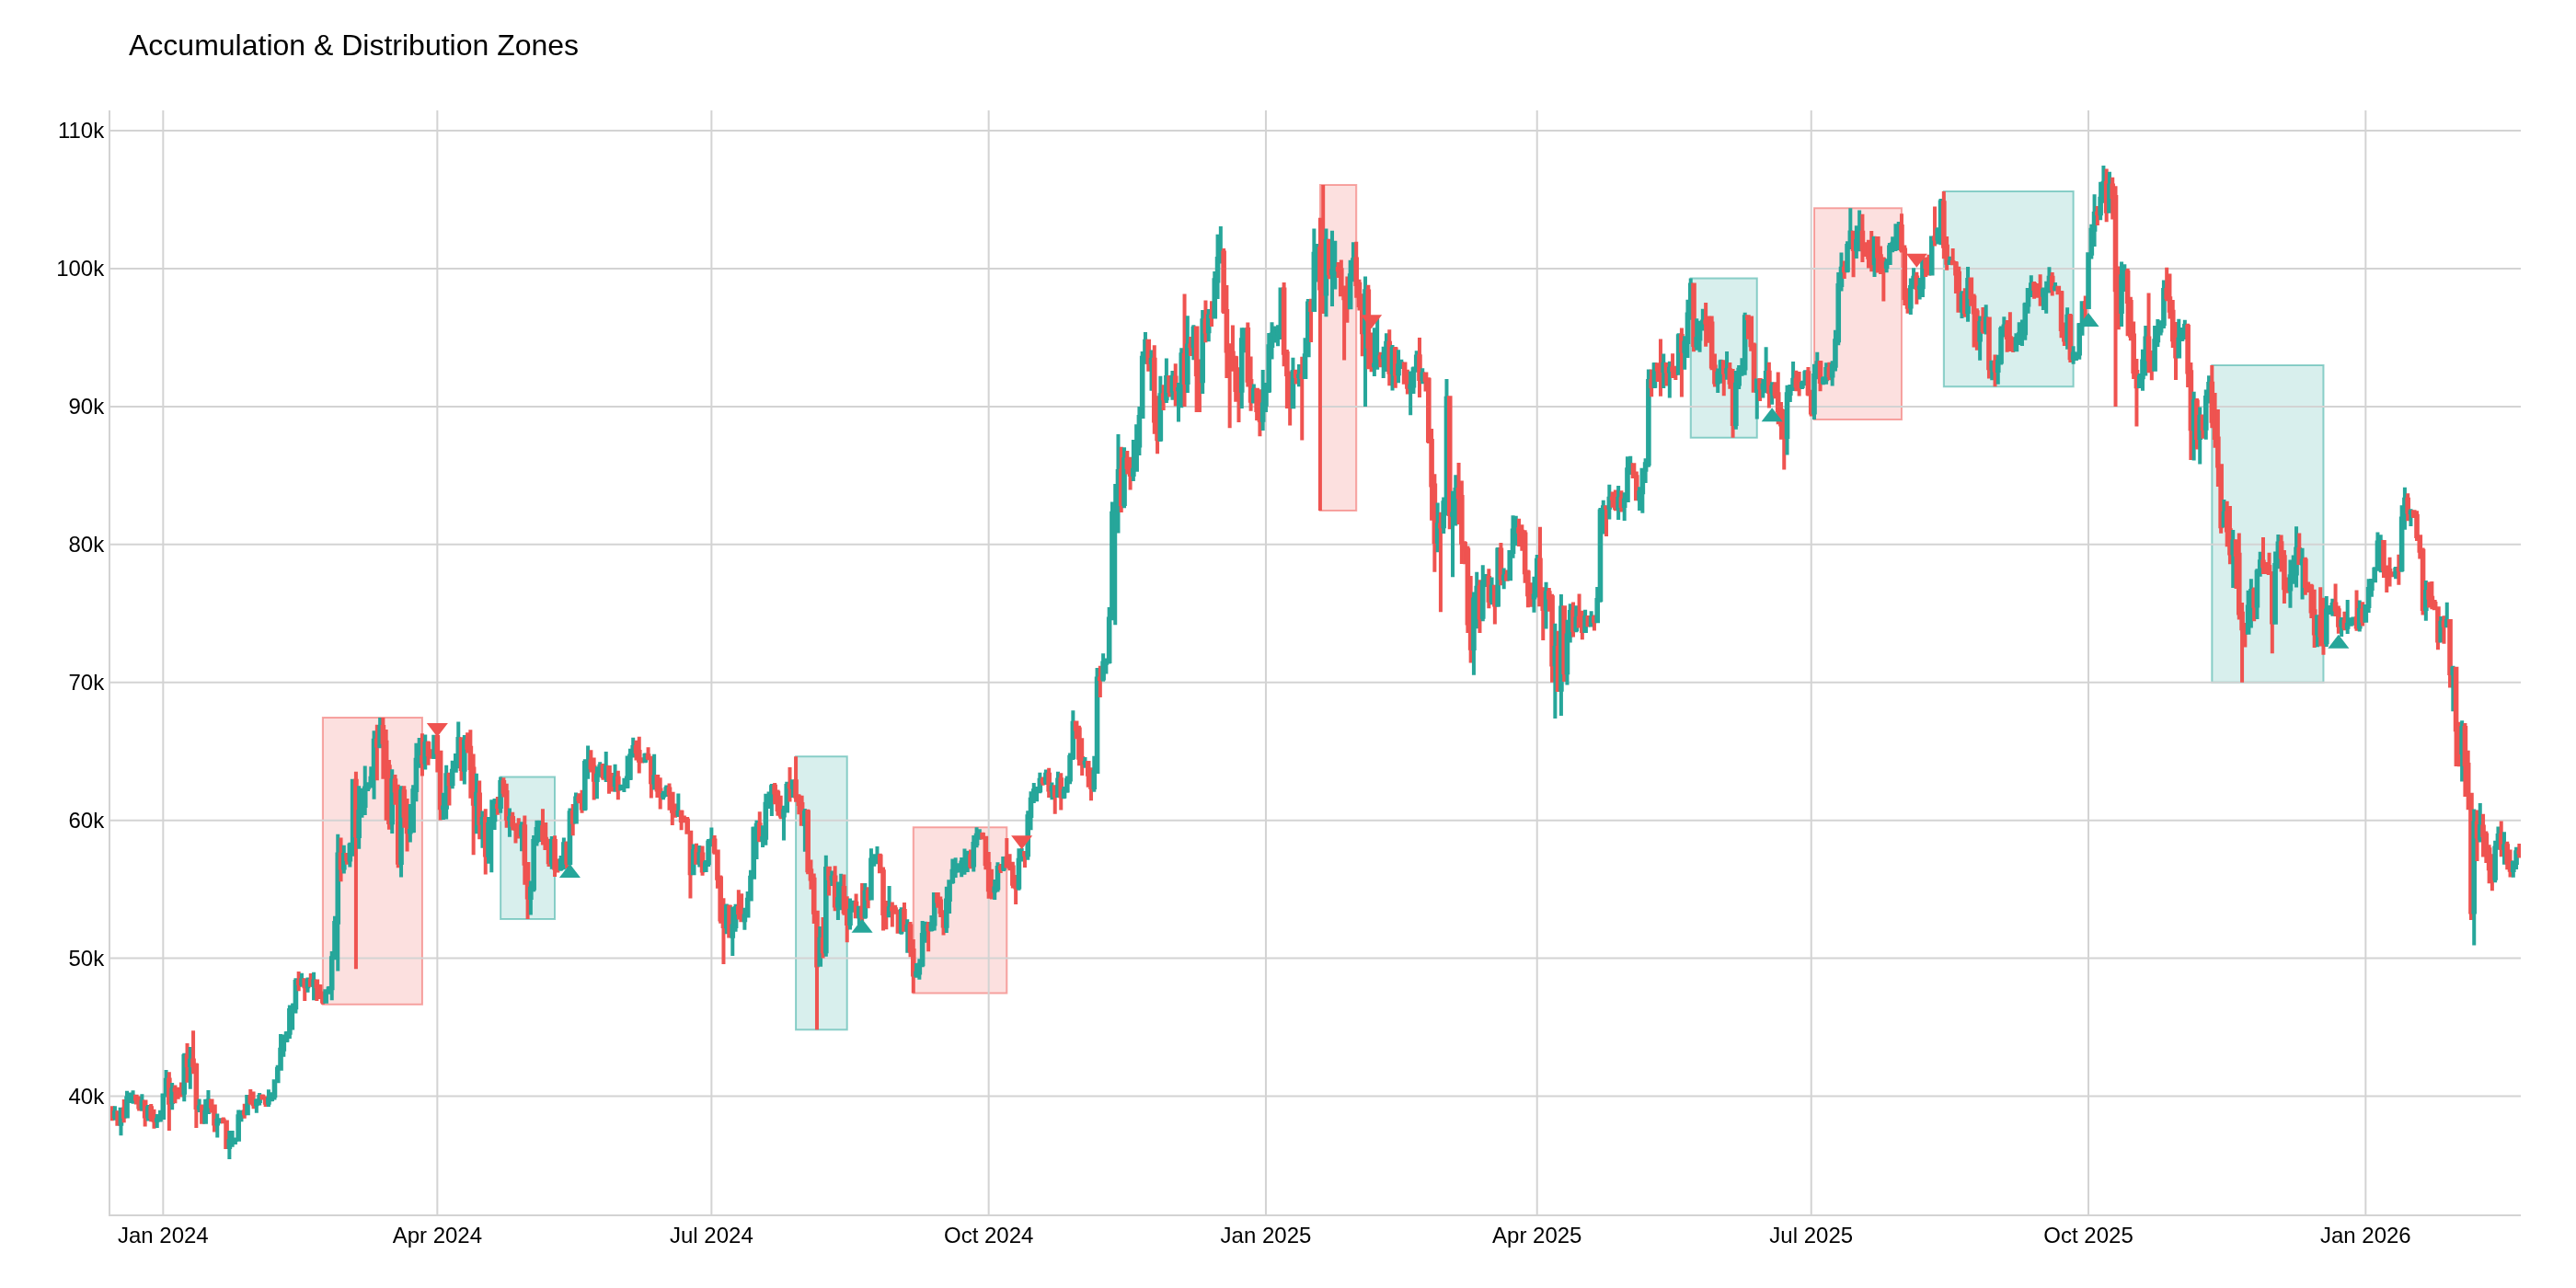
Accumulation & Distribution Zones detects Wyckoff-style converging price patterns — alternating swing highs and lows that form a narrowing price range, signaling that smart money is either accumulating (bullish) or distributing (bearish) before a breakout.
How it works:
- Detect pivot highs and lows using
pivot_lengthbar lookback - Track alternating swing points (must alternate between highs and lows)
- Check for converging pattern:
- Accumulation: Rising lows (higher lows) + falling highs (lower highs), starting from a swing low
- Distribution: Falling highs (lower highs) + rising lows (higher lows), starting from a swing high
- Report zone boundaries from the oldest to newest swing point in the pattern
Two detection modes:
- Fast — requires 4 alternating swing points (2 highs + 2 lows)
- Slow — requires 6 alternating swing points (3 highs + 3 lows) for higher conviction
def accumulation_distribution_zones(
    data: Union[PdDataFrame, PlDataFrame],
    pivot_length: int = 5,
    mode: str = "fast",
    high_column: str = "High",
    low_column: str = "Low",
    close_column: str = "Close",
    accumulation_column: str = "adz_accumulation",
    distribution_column: str = "adz_distribution",
    zone_top_column: str = "adz_zone_top",
    zone_bottom_column: str = "adz_zone_bottom",
    zone_left_column: str = "adz_zone_left",
    zone_right_column: str = "adz_zone_right",
) -> Union[PdDataFrame, PlDataFrame]:
Example
from pyindicators import (
    accumulation_distribution_zones,
    accumulation_distribution_zones_signal,
    get_accumulation_distribution_zones_stats,
)

# Calculate Accumulation & Distribution Zones
df = accumulation_distribution_zones(df, pivot_length=5, mode="fast")

# Extract signal
df = accumulation_distribution_zones_signal(df)

# Get statistics
stats = get_accumulation_distribution_zones_stats(df)
print(f"Accumulation zones: {stats['total_accumulation']}")
print(f"Distribution zones: {stats['total_distribution']}")
print(f"Total: {stats['total']}")
Output Columns:
adz_accumulation: 1 on accumulation zone confirmation bar, else 0adz_distribution: 1 on distribution zone confirmation bar, else 0adz_zone_top: Top price boundary of the detected zone (NaN otherwise)adz_zone_bottom: Bottom price boundary of the detected zone (NaN otherwise)adz_zone_left: Bar index of the oldest swing point in the zoneadz_zone_right: Bar index of the most recent swing point in the zone
Detection Modes:
| Mode | Required Swings | Description |
|---|---|---|
| Fast | 4 (2H + 2L) | Quick detection, lower conviction |
| Slow | 6 (3H + 3L) | More swing points required, higher conviction |
Pattern Structure:
| Pattern | Starting Swing | Highs | Lows | Implication |
|---|---|---|---|---|
| Accumulation | Low | Falling (lower highs) | Rising (higher lows) | Bullish breakout expected |
| Distribution | High | Falling (lower highs) | Rising (higher lows) | Bearish breakdown expected |
Signal Values (from accumulation_distribution_zones_signal):
1: Accumulation zone detected (potential long)0: Neutral-1: Distribution zone detected (potential short)