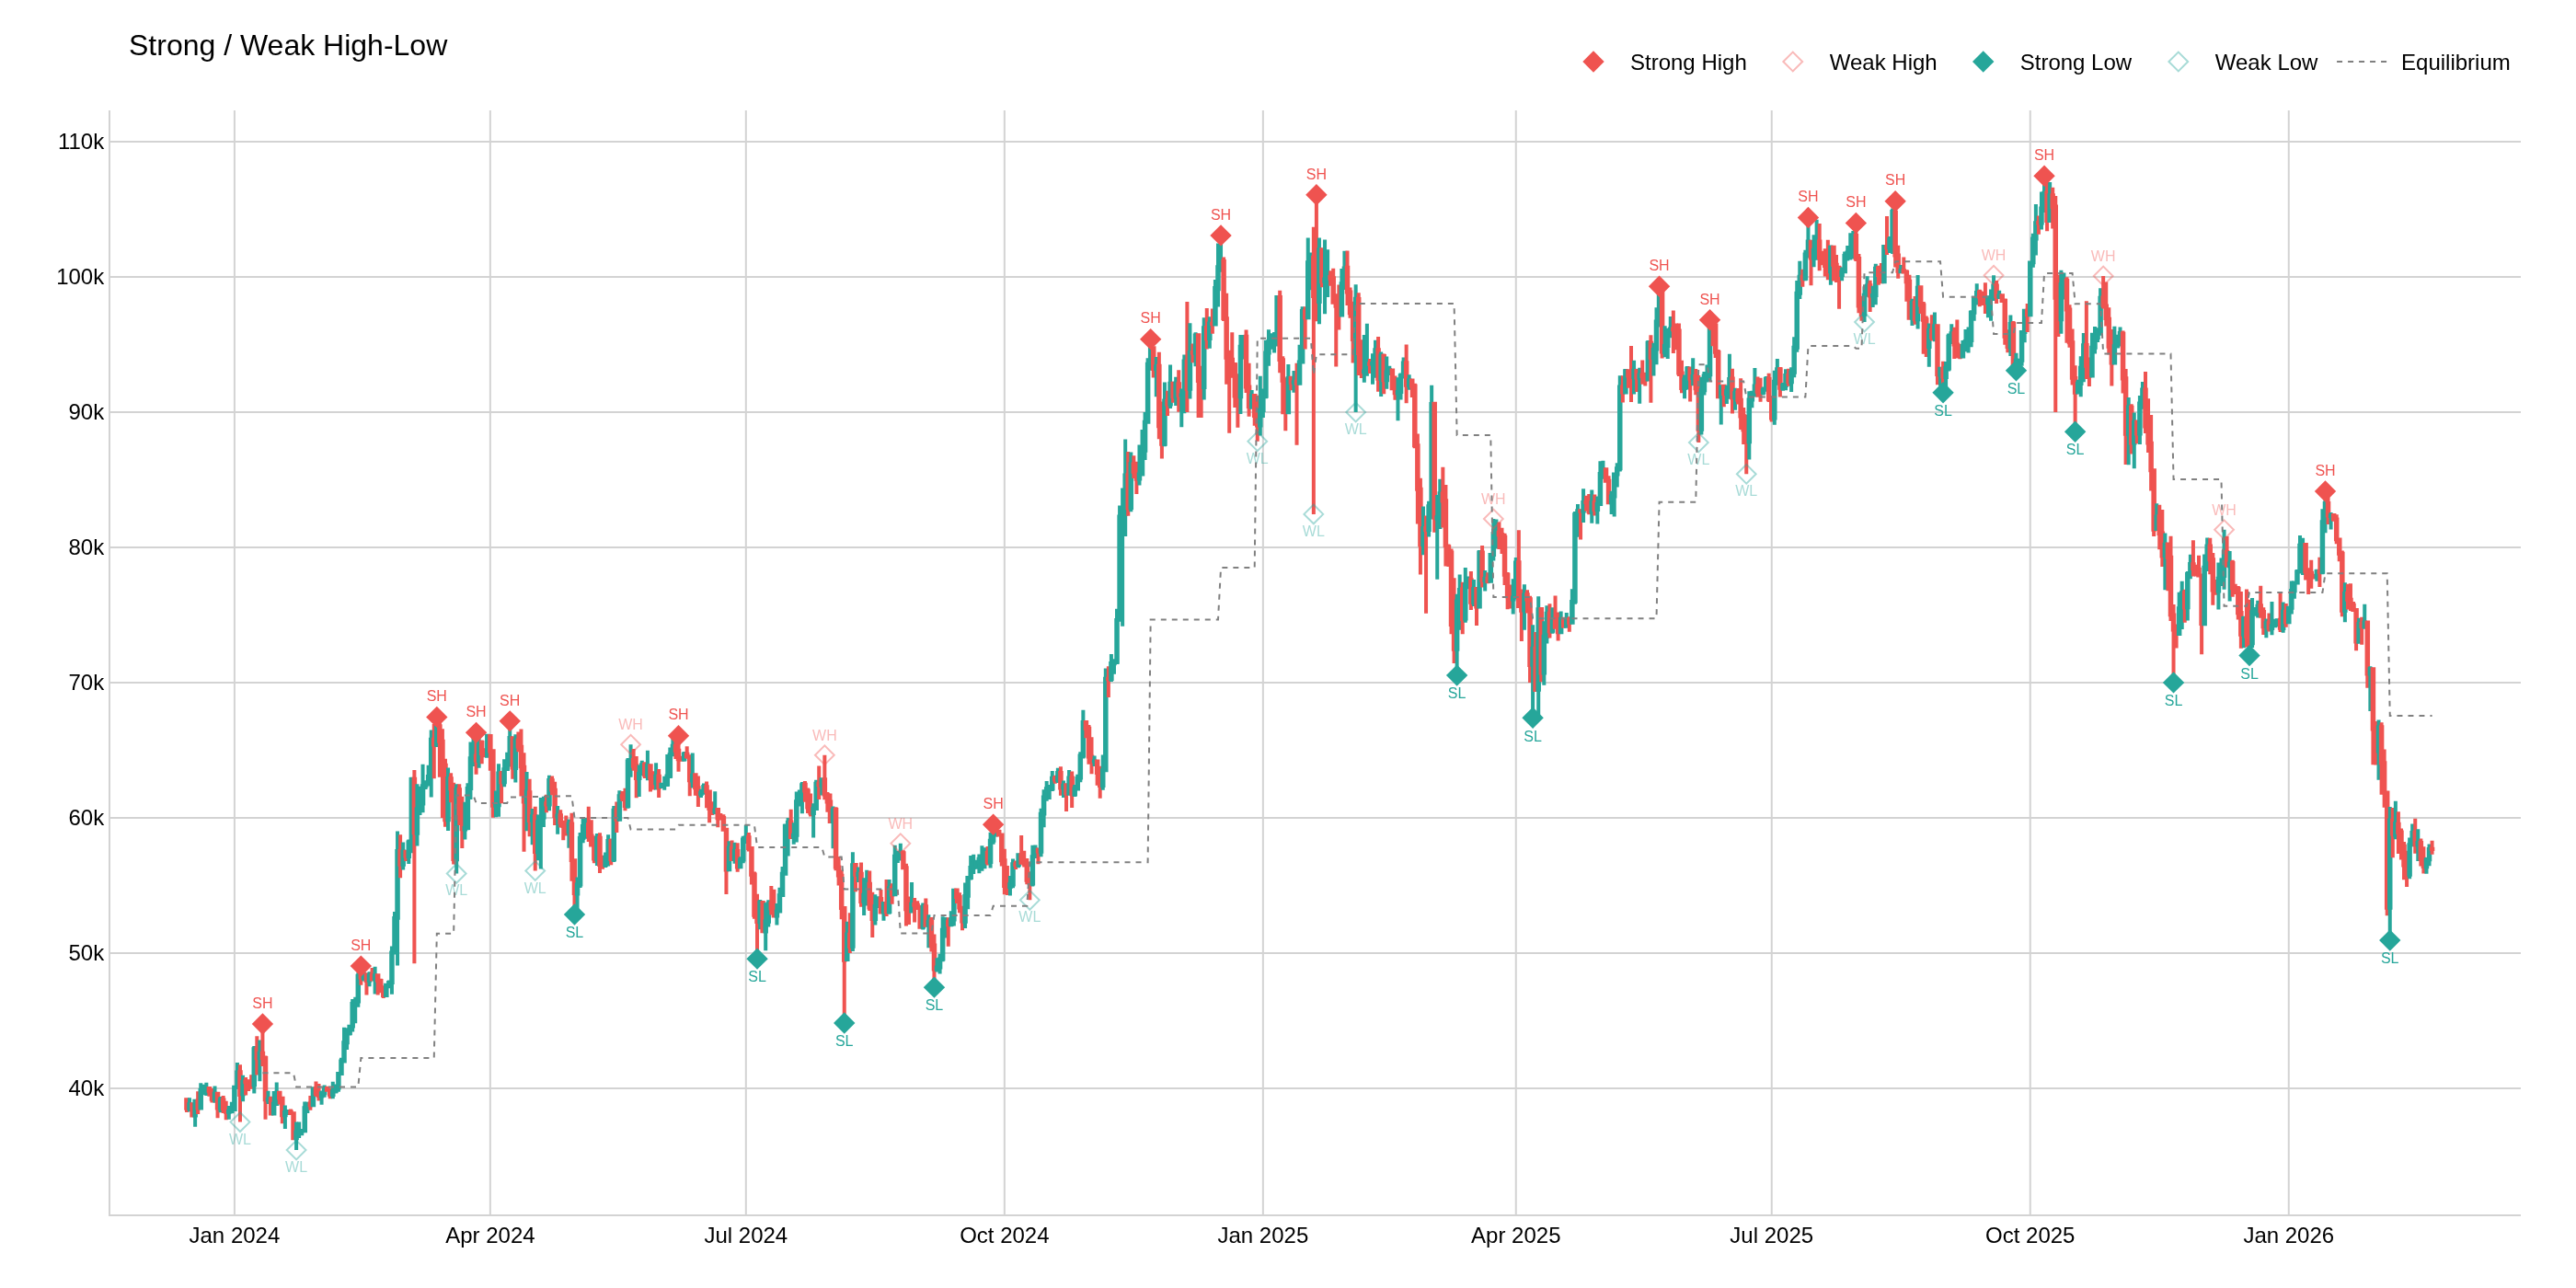
Strong / Weak Highs & Lows
Lagging Indicator
Strong / Weak classification requires confirmed swing points and trend context.
| Event | Lag | Detail |
|---|---|---|
| Detection | swing_lookback bars | A swing high/low must be confirmed by swing_lookback bars on each side |
This indicator identifies swing highs and swing lows, then classifies each as Strong or Weak based on whether the swing occurred with or against the prevailing trend and relative volume.
How it works:
- Pivot detection — Using a scaled lookback (
swing_lookback // 5, minimum 1), identify bars that are local highs/lows - Trend determination — A rolling window (
trend_lookback) checks whether price has broken above the highest high (bullish) or below the lowest low (bearish) - Classification:
- Strong High = swing high that forms in a bearish trend (counter-trend → likely to hold)
- Weak High = swing high that forms in a bullish trend (with-trend → likely to break)
- Strong Low = swing low that forms in a bullish trend (counter-trend → likely to hold)
- Weak Low = swing low that forms in a bearish trend (with-trend → likely to break)
- Volume enrichment — each swing point stores the volume and relative volume percentile
- Equilibrium — midpoint between the most recent swing high and swing low
def strong_weak_high_low(
    data: Union[PdDataFrame, PlDataFrame],
    swing_lookback: int = 10,
    trend_lookback: int = 50,
    open_column: str = "Open",
    high_column: str = "High",
    low_column: str = "Low",
    close_column: str = "Close",
    volume_column: str = "Volume",
) -> Union[PdDataFrame, PlDataFrame]:
Example
from pyindicators import (
    strong_weak_high_low,
    strong_weak_high_low_signal,
    get_strong_weak_high_low_stats,
)

# Detect & classify swings
df = strong_weak_high_low(df, swing_lookback=10, trend_lookback=50)

# Generate signal
df = strong_weak_high_low_signal(df)

# Get statistics
stats = get_strong_weak_high_low_stats(df)
print(f"Strong Highs: {stats['strong_highs']}")
print(f"Strong Lows:  {stats['strong_lows']}")
print(f"Weak Highs:   {stats['weak_highs']}")
print(f"Weak Lows:    {stats['weak_lows']}")
Output Columns:
| Column | Description |
|---|---|
sw_high | 1 on bars with a swing high, else 0 |
sw_low | 1 on bars with a swing low, else 0 |
sw_high_price | Price of the swing high (NaN otherwise) |
sw_low_price | Price of the swing low (NaN otherwise) |
sw_high_type | "Strong" or "Weak" (empty string otherwise) |
sw_low_type | "Strong" or "Weak" (empty string otherwise) |
sw_high_volume | Volume at the swing high bar |
sw_low_volume | Volume at the swing low bar |
sw_high_vol_pct | Volume percentile of the swing high bar (0–100) |
sw_low_vol_pct | Volume percentile of the swing low bar (0–100) |
sw_equilibrium | Midpoint between the most recent swing high and swing low |
sw_signal | +1 on Strong Low, −1 on Strong High, 0 otherwise |