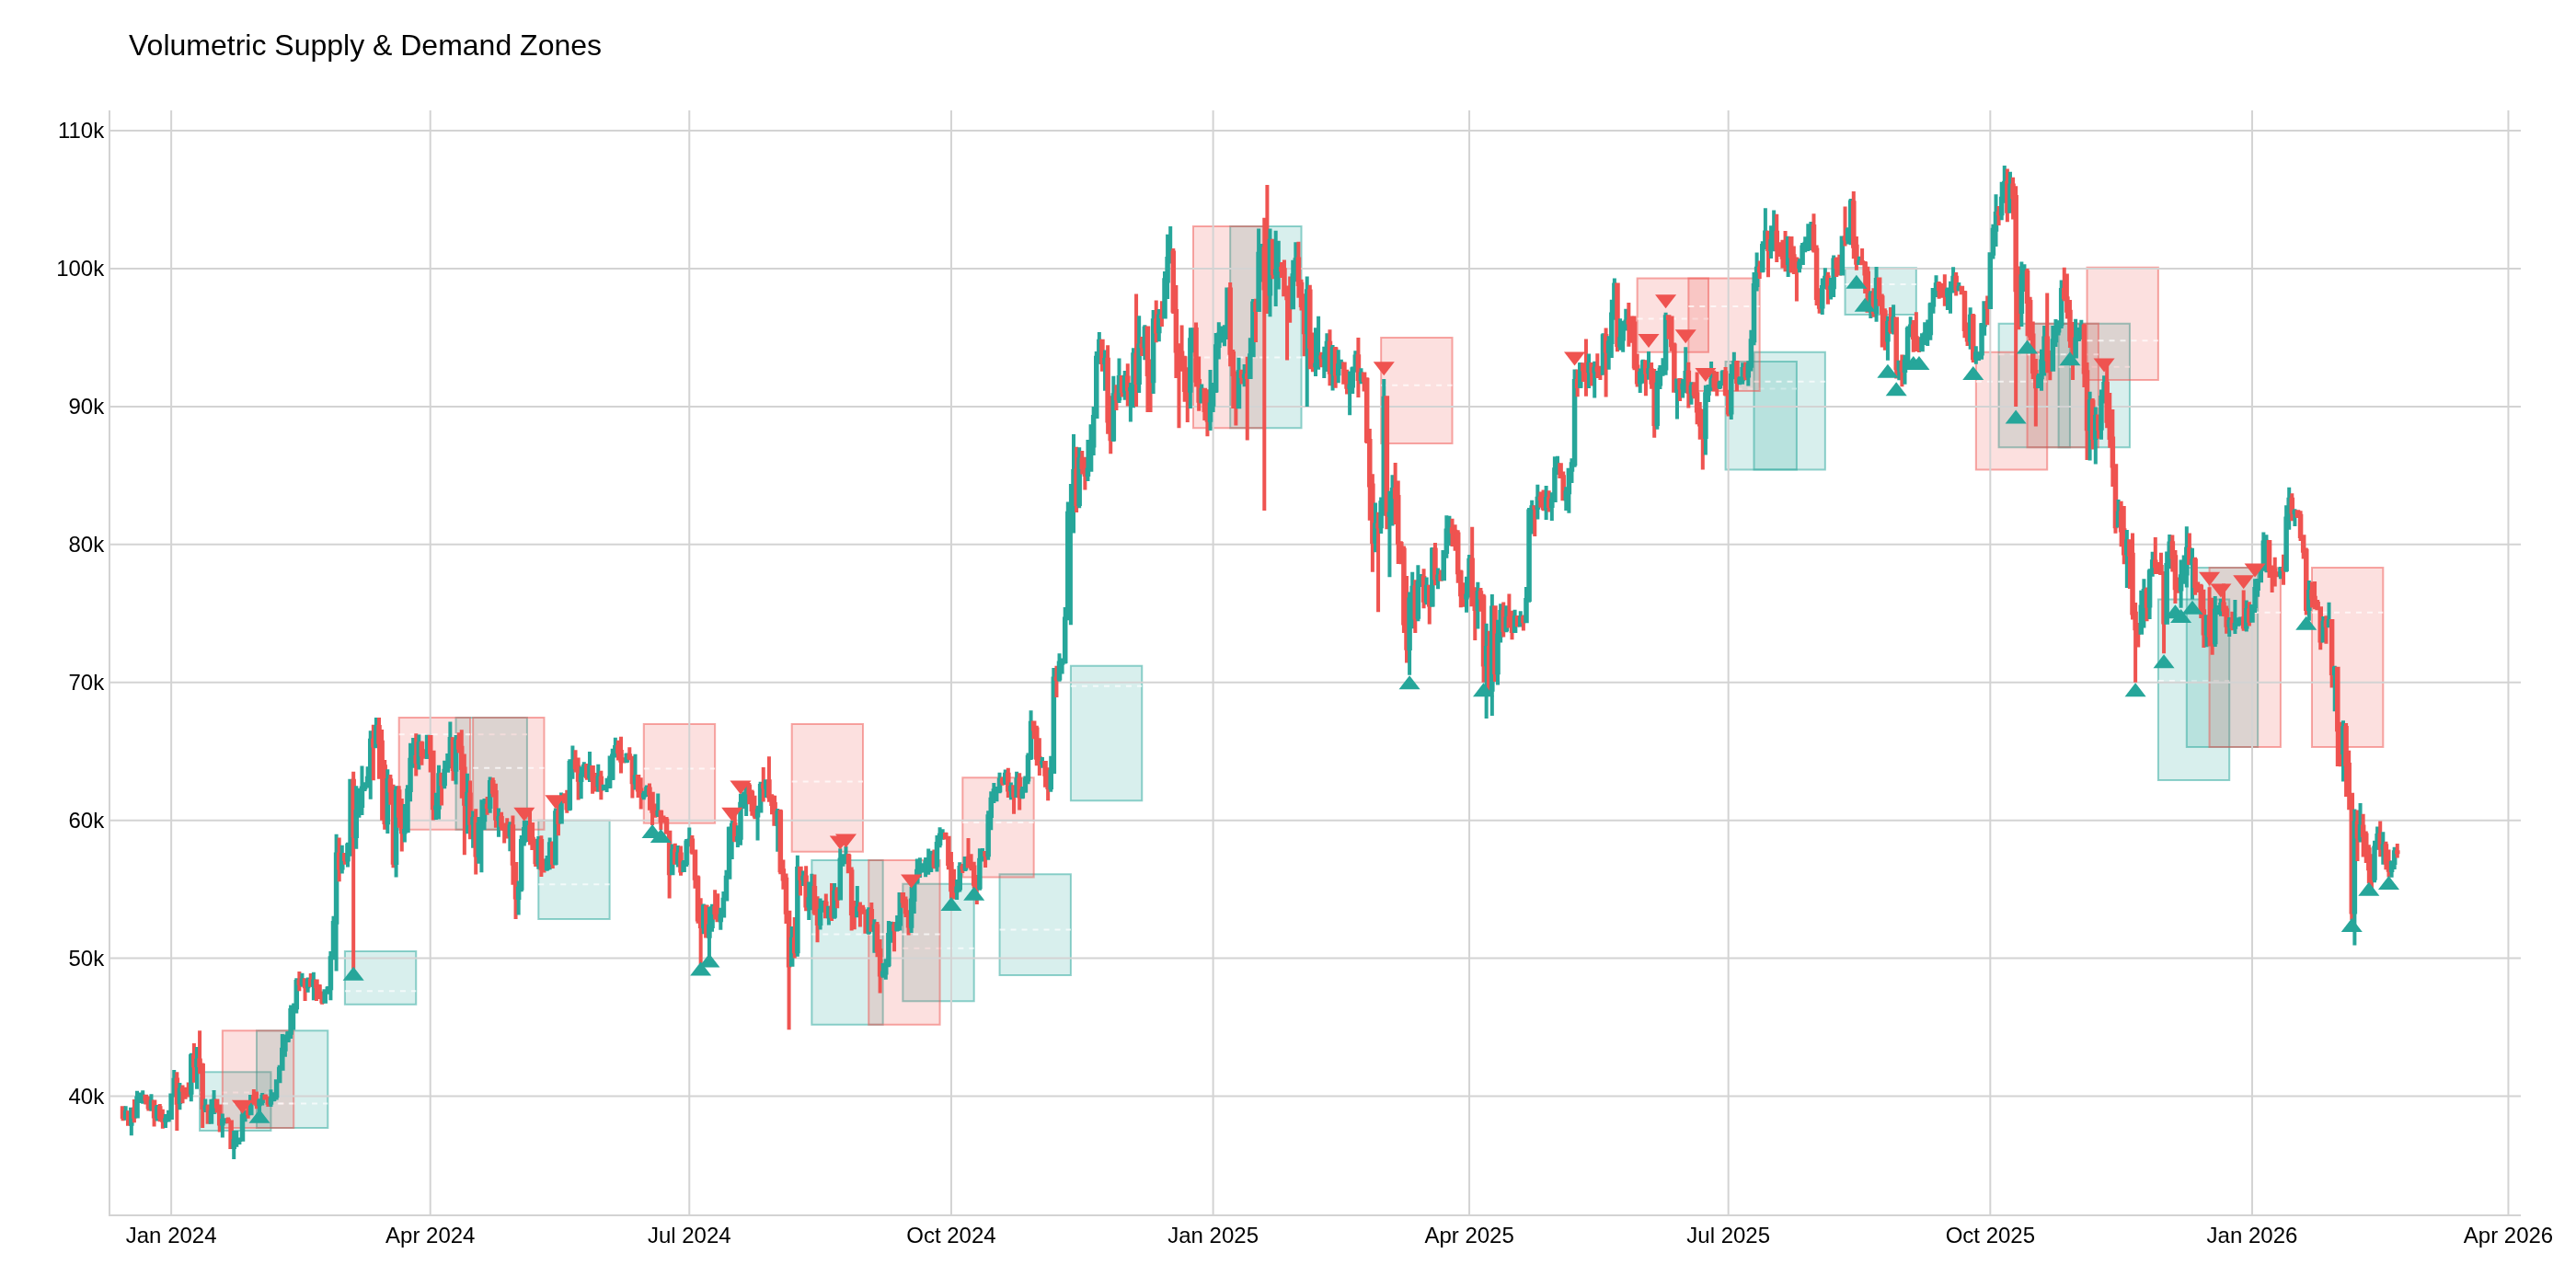
Volumetric Supply & Demand Zones
Real-time Indicator
Zone detection is triggered immediately when a pivot is confirmed with a qualifying impulse move.
| Event | Lag | Detail |
|---|---|---|
| Zone creation | ≈ swing_length bars | Pivot confirmation requires swing_length bars on each side (default 8) |
| Volume profile | 0 bars | Built from base candles at time of zone creation |
| Mitigation | 0 bars | Checked in real-time as price crosses zone boundaries |
Formula for custom params: lag ≈ swing_length (pivot confirmation delay)
Volumetric Supply and Demand Zones detects key supply (resistance) and demand (support) zones at significant swing points, enriched with volume distribution and buy/sell delta analysis within each zone.
How it works:
- Detect pivot highs and lows using
swing_lengthbar lookback - Validate that the subsequent price move exceeds
impulse_mult × ATR - Build zone boundaries from the
base_lookbackcandles around the pivot - Distribute volume across
profile_rowshorizontal slices within the zone - Calculate buy vs sell delta per row (bullish candles = buy, bearish = sell)
- Identify the Point of Control (POC) — the price row with highest volume
- Track zone lifecycle: Fresh → Tested → Mitigated
- Optionally merge overlapping same-type zones
def volumetric_supply_demand_zones(
    data: Union[PdDataFrame, PlDataFrame],
    swing_length: int = 8,
    impulse_mult: float = 1.2,
    base_lookback: int = 3,
    atr_length: int = 14,
    max_zone_atr: float = 4.0,
    max_zones: int = 10,
    merge_zones: bool = True,
    merge_gap_atr: float = 0.3,
    mitigation_type: str = "Wick",
    profile_rows: int = 10,
    high_column: str = 'High',
    low_column: str = 'Low',
    open_column: str = 'Open',
    close_column: str = 'Close',
    volume_column: str = 'Volume',
) -> Union[PdDataFrame, PlDataFrame]:
Example
from pyindicators import (
    volumetric_supply_demand_zones,
    volumetric_supply_demand_zones_signal,
    get_volumetric_supply_demand_zones_stats,
)

# Calculate Volumetric Supply & Demand Zones
df = volumetric_supply_demand_zones(df)

# Extract signal (already computed, returned for API consistency)
df = volumetric_supply_demand_zones_signal(df)

# Get statistics
stats = get_volumetric_supply_demand_zones_stats(df)
print(f"Demand zones: {stats['total_demand_zones']}")
print(f"Supply zones: {stats['total_supply_zones']}")
print(f"Avg zone volume: {stats['avg_zone_volume']}")
Output Columns:
vsdz_demand: 1 on demand zone formation bar, else 0vsdz_supply: 1 on supply zone formation bar, else 0vsdz_zone_top/vsdz_zone_bottom: Active zone boundariesvsdz_poc: Point of Control — price level with highest volumevsdz_zone_type: 1 (demand) or -1 (supply)vsdz_volume: Total volume accumulated in the zonevsdz_delta: Net buy-sell volume delta in the zonevsdz_status: Zone lifecycle status (Fresh / Tested / Mitigated)vsdz_touches: Number of times the zone has been testedvsdz_signal: Trading signal (+1 demand entry, -1 supply entry, 0 neutral)
Zone Lifecycle:
| Status | Meaning |
|---|---|
| Fresh | Newly created, price has not revisited |
| Tested | Price has touched the zone at least once |
| Mitigated | Price broke through the zone boundary |
Mitigation Types:
| Type | Rule |
|---|---|
| Wick | Zone broken when any wick crosses the boundary |
| Close | Zone broken when candle closes beyond the boundary |
Signal Values (from volumetric_supply_demand_zones_signal):
1: Price enters a demand zone (potential long)0: Neutral-1: Price enters a supply zone (potential short)