Optimal Trade Entry (OTE)
Minimum bars needed: 2 × swing_length + 1 bars
(default params: 11 bars (swing_length=5))
Requires confirmed swing pivots and a market structure shift. After warmup, OTE zones appear in real-time.
✅ After the warmup window is filled, this indicator produces a new value on every incoming bar in real-time.
OTE zones appear after swing confirmation, not after smoothing delay.
| Event | Lag | Detail |
|---|---|---|
| OTE zone appears | ≈ swing_length bars after the pivot | Fibonacci retracement of impulse leg after MSS; depends on swing/zigzag confirmation |
| Signal fires when price enters OTE zone | 0 bars | Instant once the zone exists |
Identifies ICT Optimal Trade Entry zones — the Fibonacci 61.8 %–78.6 % retracement of an impulse leg following a Market Structure Shift (MSS).
Concept (ICT / Smart Money):
- After a Break of Structure, the market typically retraces before continuing. The OTE zone (61.8 %–78.6 % Fibonacci retracement) is where institutional traders are most likely to enter or add to positions.
- Bullish OTE: After a bullish MSS (close breaks swing high with confirmed Lower Low), the OTE zone is the 61.8 %–78.6 % pullback of the impulse leg from swing low to the MSS bar.
- Bearish OTE: After a bearish MSS (close breaks swing low with confirmed Higher High), the OTE zone is the 61.8 %–78.6 % retracement from swing high down to the MSS bar.
Signals:
- Entry Long: Price retraces into the bullish OTE zone (potential long entry)
- Entry Short: Price retraces into the bearish OTE zone (potential short entry)
- Invalidated: Price closes beyond the impulse origin (zone no longer valid)
Optional Premium/Discount filter: Only emit bullish OTEs when the impulse origin is in the discount zone, and bearish OTEs when in the premium zone.
def optimal_trade_entry(
    data: Union[PdDataFrame, PlDataFrame],
    swing_length: int = 5,
    ote_fib_start: float = 0.618,
    ote_fib_end: float = 0.786,
    premium_discount_filter: bool = False,
    high_column: str = "High",
    low_column: str = "Low",
    open_column: str = "Open",
    close_column: str = "Close",
) -> Union[PdDataFrame, PlDataFrame]:
Returns the following columns:
ote_bullish/ote_bearish: 1 when an OTE zone is establishedote_zone_top/ote_zone_bottom: Active OTE zone boundaries (forward-filled)ote_direction: 1 for bullish OTE, -1 for bearish OTE, 0 when no OTE is activeote_entry_long/ote_entry_short: 1 when price enters the OTE zoneote_invalidated: 1 when the OTE zone is invalidatedote_impulse_high/ote_impulse_low: Impulse leg boundariesote_fib_*: Fibonacci retracement levels (0 %, 23.6 %, 38.2 %, 50 %, 61.8 %, 70.5 %, 78.6 %, 100 %)
Signal function:
ote_signal:1= long entry,-1= short entry,0= no signal
Example
from investing_algorithm_framework import download

from pyindicators import (
    optimal_trade_entry,
    optimal_trade_entry_signal,
    get_optimal_trade_entry_stats,
)

pd_df = download(
    symbol="btc/eur",
    market="bitvavo",
    time_frame="4h",
    start_date="2024-01-01",
    end_date="2024-06-01",
    pandas=True,
)

# Detect Optimal Trade Entry zones
pd_df = optimal_trade_entry(pd_df, swing_length=5)
pd_df = optimal_trade_entry_signal(pd_df)

# Get summary statistics
stats = get_optimal_trade_entry_stats(pd_df)
print(stats)

pd_df[["Close", "ote_bullish", "ote_bearish", "ote_zone_top",
       "ote_zone_bottom", "ote_entry_long", "ote_entry_short",
       "ote_signal"]].tail(10)
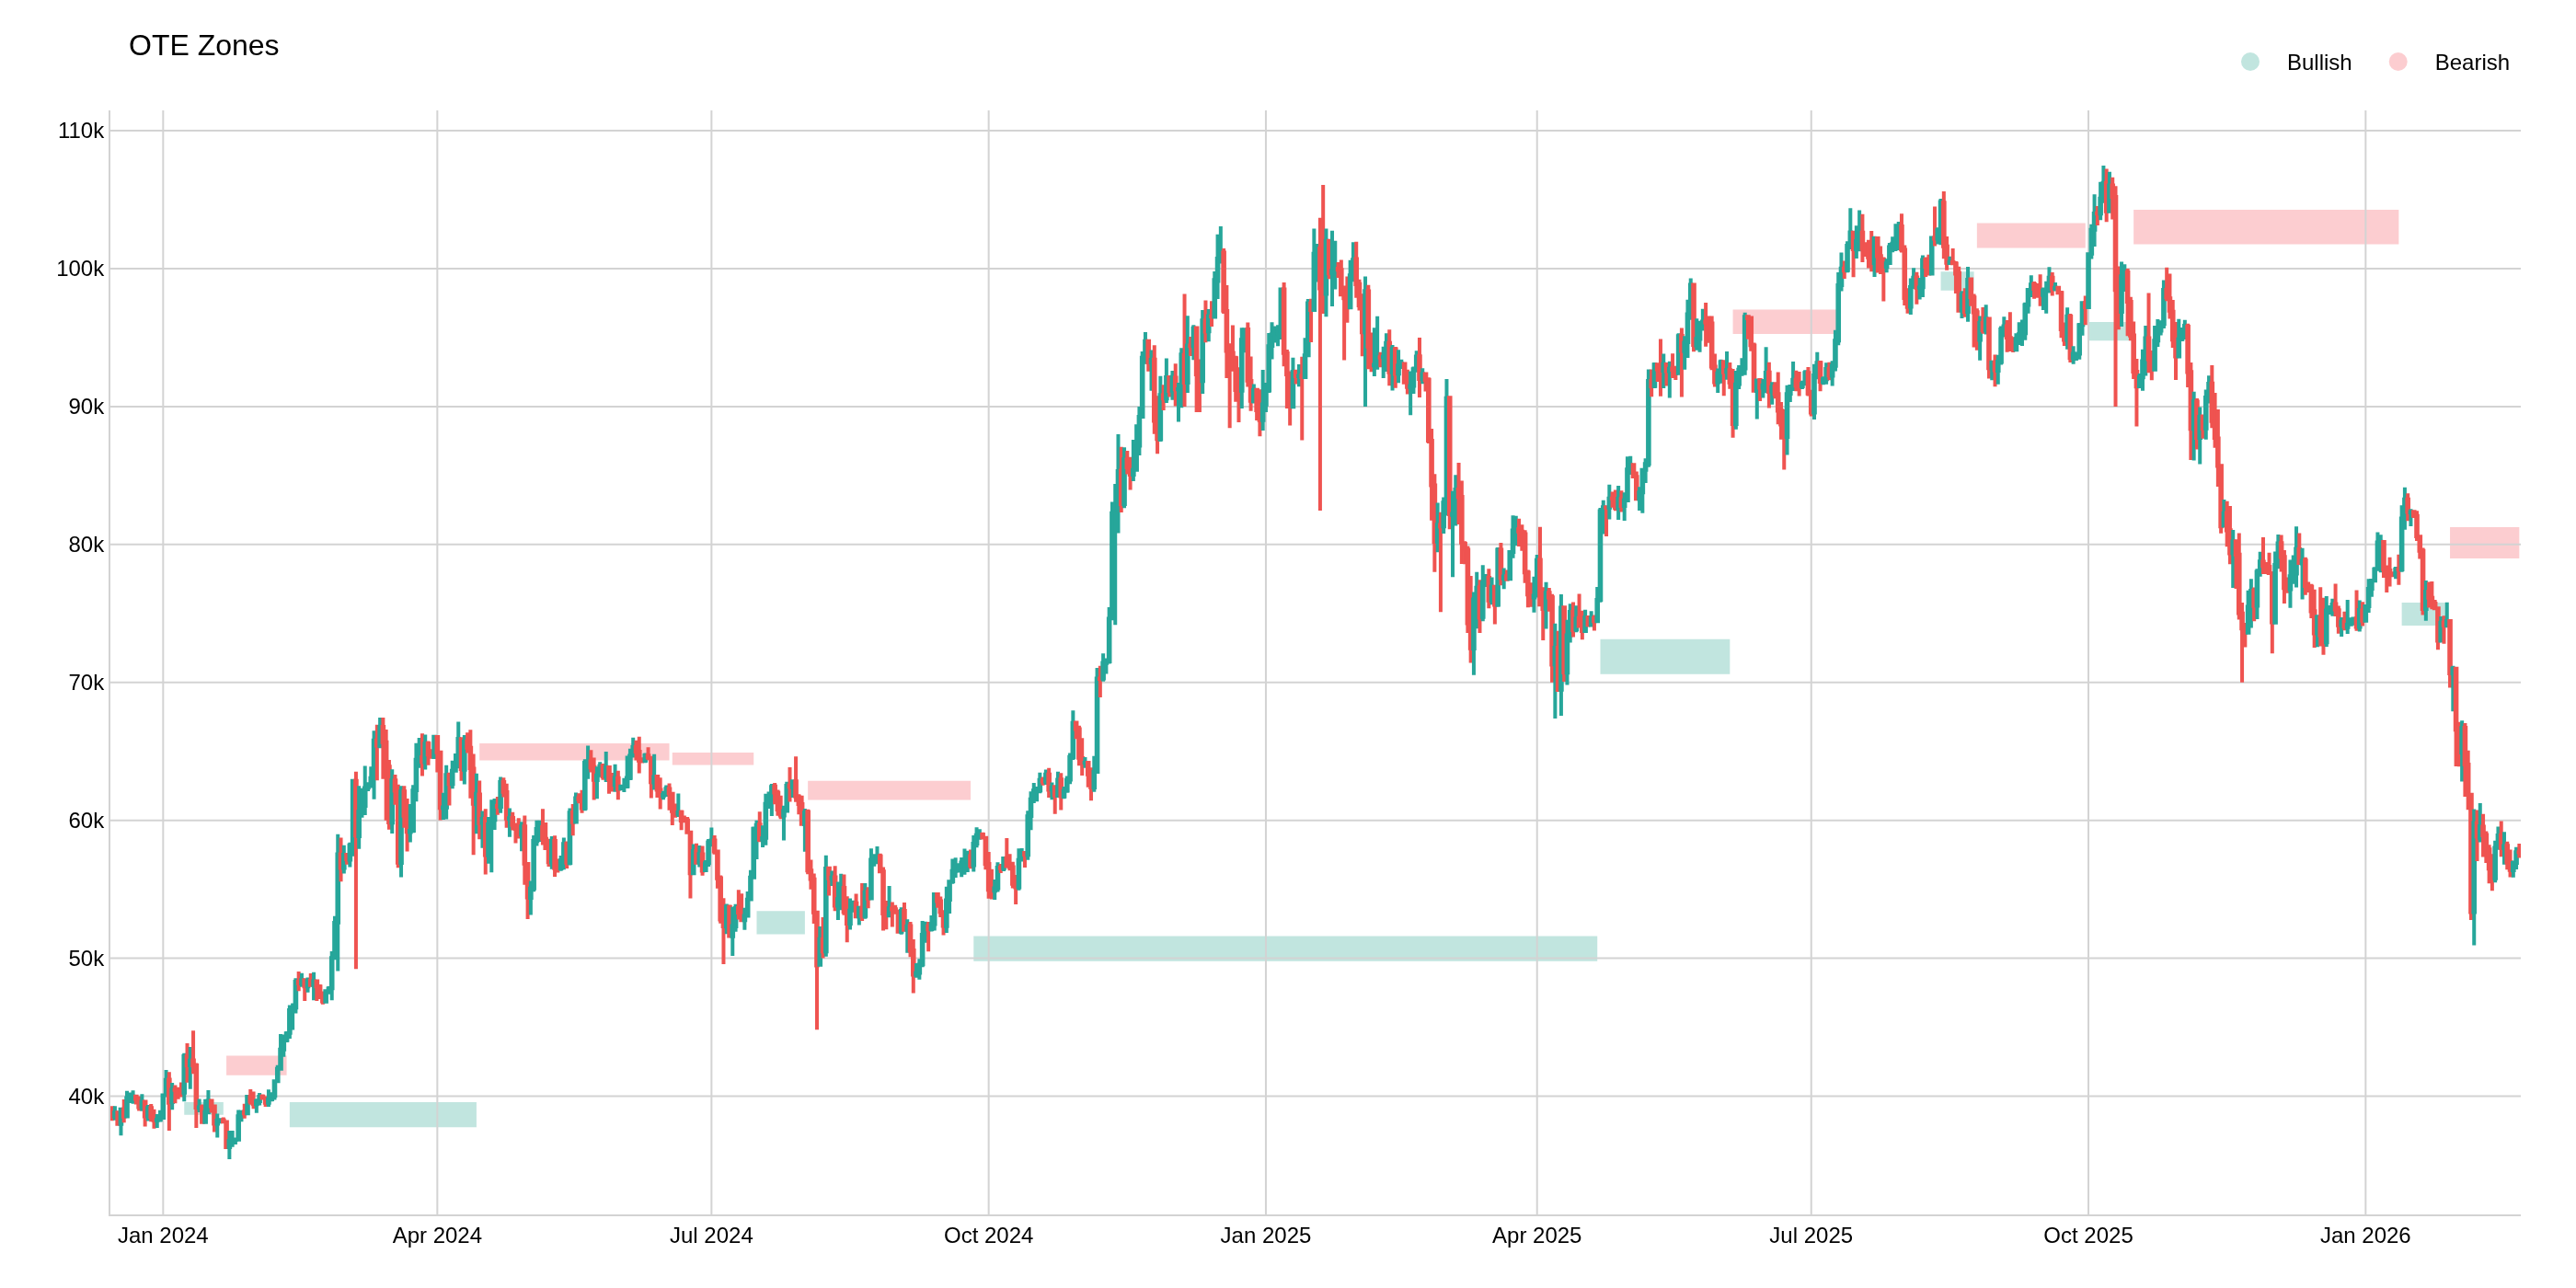
The image above uses the following parameters:
| Parameter | Value |
|---|---|
swing_length | 5 |