Market Structure CHoCH/BOS
Minimum bars needed: 2 × length + 1 bars
(default params: 11 bars (length=5))
Fractal swing points need length bars on each side. After the first fractals are confirmed, CHoCH/BOS signals fire in real-time.
✅ After the warmup window is filled, this indicator produces a new value on every incoming bar in real-time.
CHoCH and BOS signals fire after fractal confirmation, not after smoothing delay.
| Event | Lag | Detail |
|---|---|---|
| CHoCH / BOS signal fires | ≈ length bars after the fractal | Fractal swing points need length bars on each side; signal fires when close breaks past the confirmed fractal |
Market Structure CHoCH/BOS (Fractal) is a Smart Money Concept indicator that uses fractal detection to identify swing points and distinguishes between two types of structure breaks:
CHoCH (Change of Character): A trend reversal signal that occurs when price breaks a swing point in the opposite direction of the current trend.
- Bullish CHoCH: Trend was bearish, price breaks above swing high (reversal to bullish)
- Bearish CHoCH: Trend was bullish, price breaks below swing low (reversal to bearish)
BOS (Break of Structure): A trend continuation signal that occurs when price breaks a swing point in the same direction as the current trend.
- Bullish BOS: Trend is bullish, price breaks above swing high (continuation)
- Bearish BOS: Trend is bearish, price breaks below swing low (continuation)
This indicator also tracks dynamic support and resistance levels based on the swing structure.
def market_structure_choch_bos(
    data: Union[PdDataFrame, PlDataFrame],
    length: int = 5,
    high_column: str = 'High',
    low_column: str = 'Low',
    close_column: str = 'Close',
    choch_bullish_column: str = 'choch_bullish',
    choch_bearish_column: str = 'choch_bearish',
    bos_bullish_column: str = 'bos_bullish',
    bos_bearish_column: str = 'bos_bearish',
    support_column: str = 'support_level',
    resistance_column: str = 'resistance_level',
    support_broken_column: str = 'support_broken',
    resistance_broken_column: str = 'resistance_broken',
    trend_column: str = 'market_trend'
) -> Union[PdDataFrame, PlDataFrame]:
Example
import pandas as pd
from pyindicators import (
    market_structure_choch_bos,
    choch_bos_signal,
    get_choch_bos_stats
)

# Create sample OHLC data
df = pd.DataFrame({
    'High': [...],
    'Low': [...],
    'Close': [...]
})

# Detect CHoCH and BOS signals
df = market_structure_choch_bos(df, length=5)
print(df[['choch_bullish', 'choch_bearish', 'bos_bullish', 'bos_bearish', 'market_trend']])

# Generate trading signals
# 2 = bullish CHoCH (strong reversal), 1 = bullish BOS (continuation)
# -1 = bearish BOS (continuation), -2 = bearish CHoCH (strong reversal)
df = choch_bos_signal(df)
reversal_signals = df[abs(df['structure_signal']) == 2]

# Get statistics
stats = get_choch_bos_stats(df)
print(f"Total reversals (CHoCH): {stats['total_choch']}")
print(f"Total continuations (BOS): {stats['total_bos']}")
The function returns:
choch_bullish/choch_bearish: 1 when CHoCH detected (trend reversal)bos_bullish/bos_bearish: 1 when BOS detected (trend continuation)support_level/resistance_level: Current S/R level pricessupport_broken/resistance_broken: 1 when S/R level is brokenmarket_trend: Current trend direction (1=bullish, -1=bearish, 0=neutral)
Trading Strategy:
- CHoCH signals are stronger (trend reversals) - good for counter-trend entries
- BOS signals are trend confirmations - good for trend-following entries
- Use support/resistance levels for stop loss placement
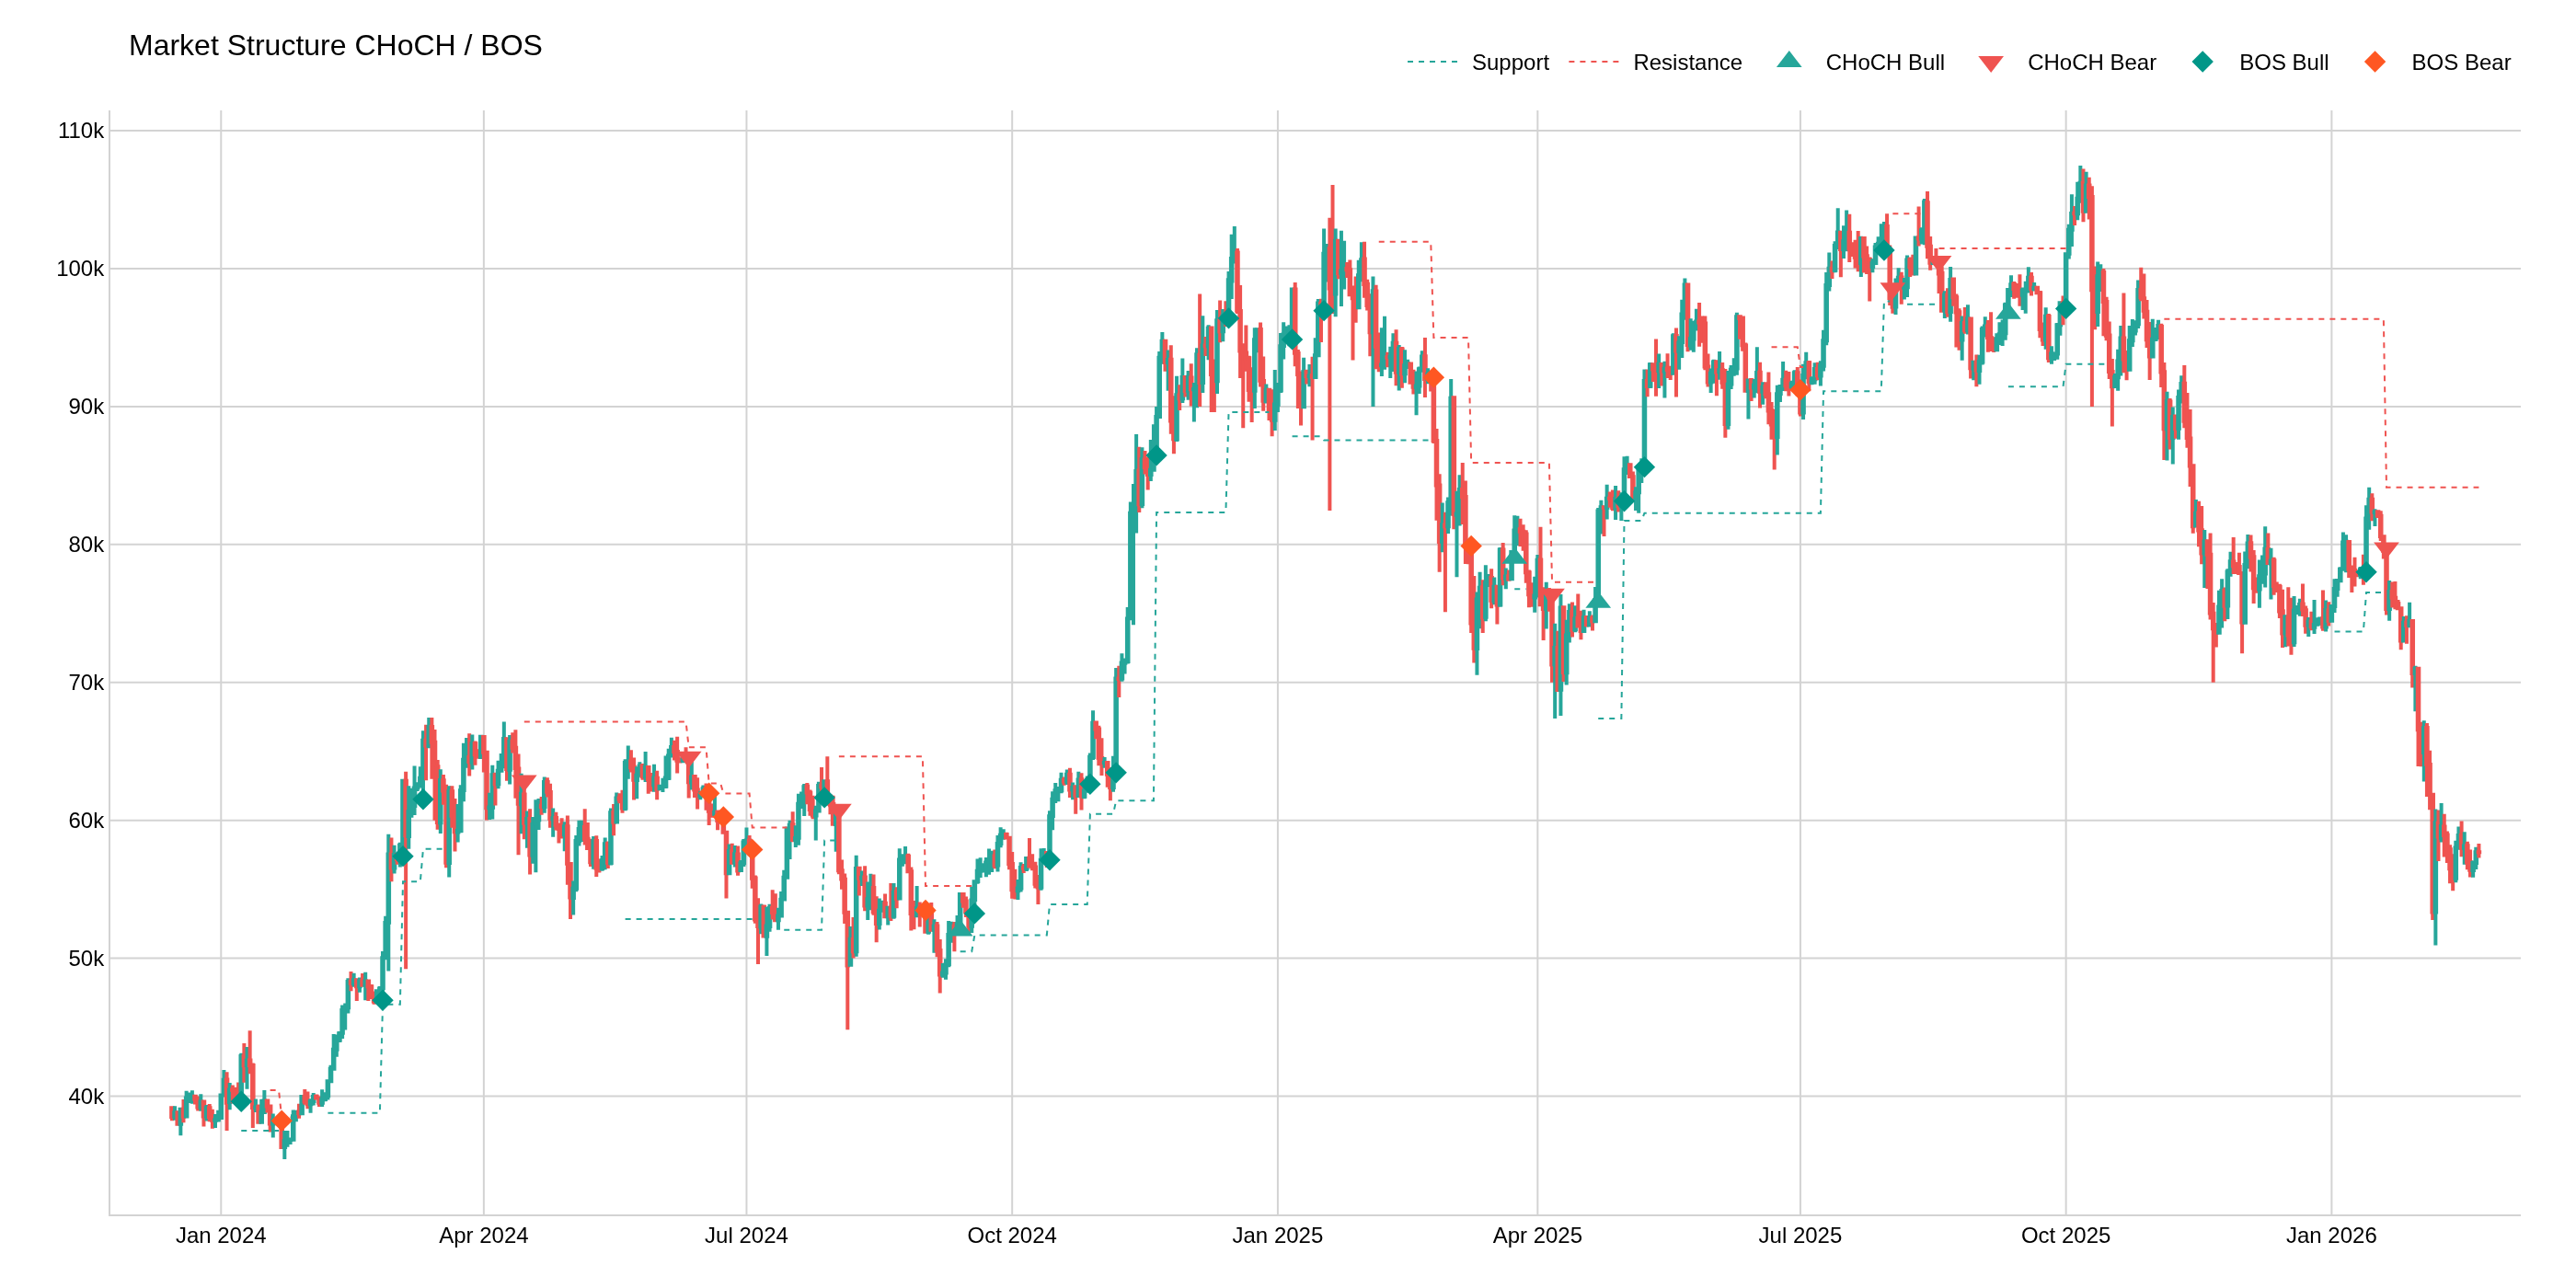
The image above uses the following parameters:
| Parameter | Value |
|---|---|
length | 5 |