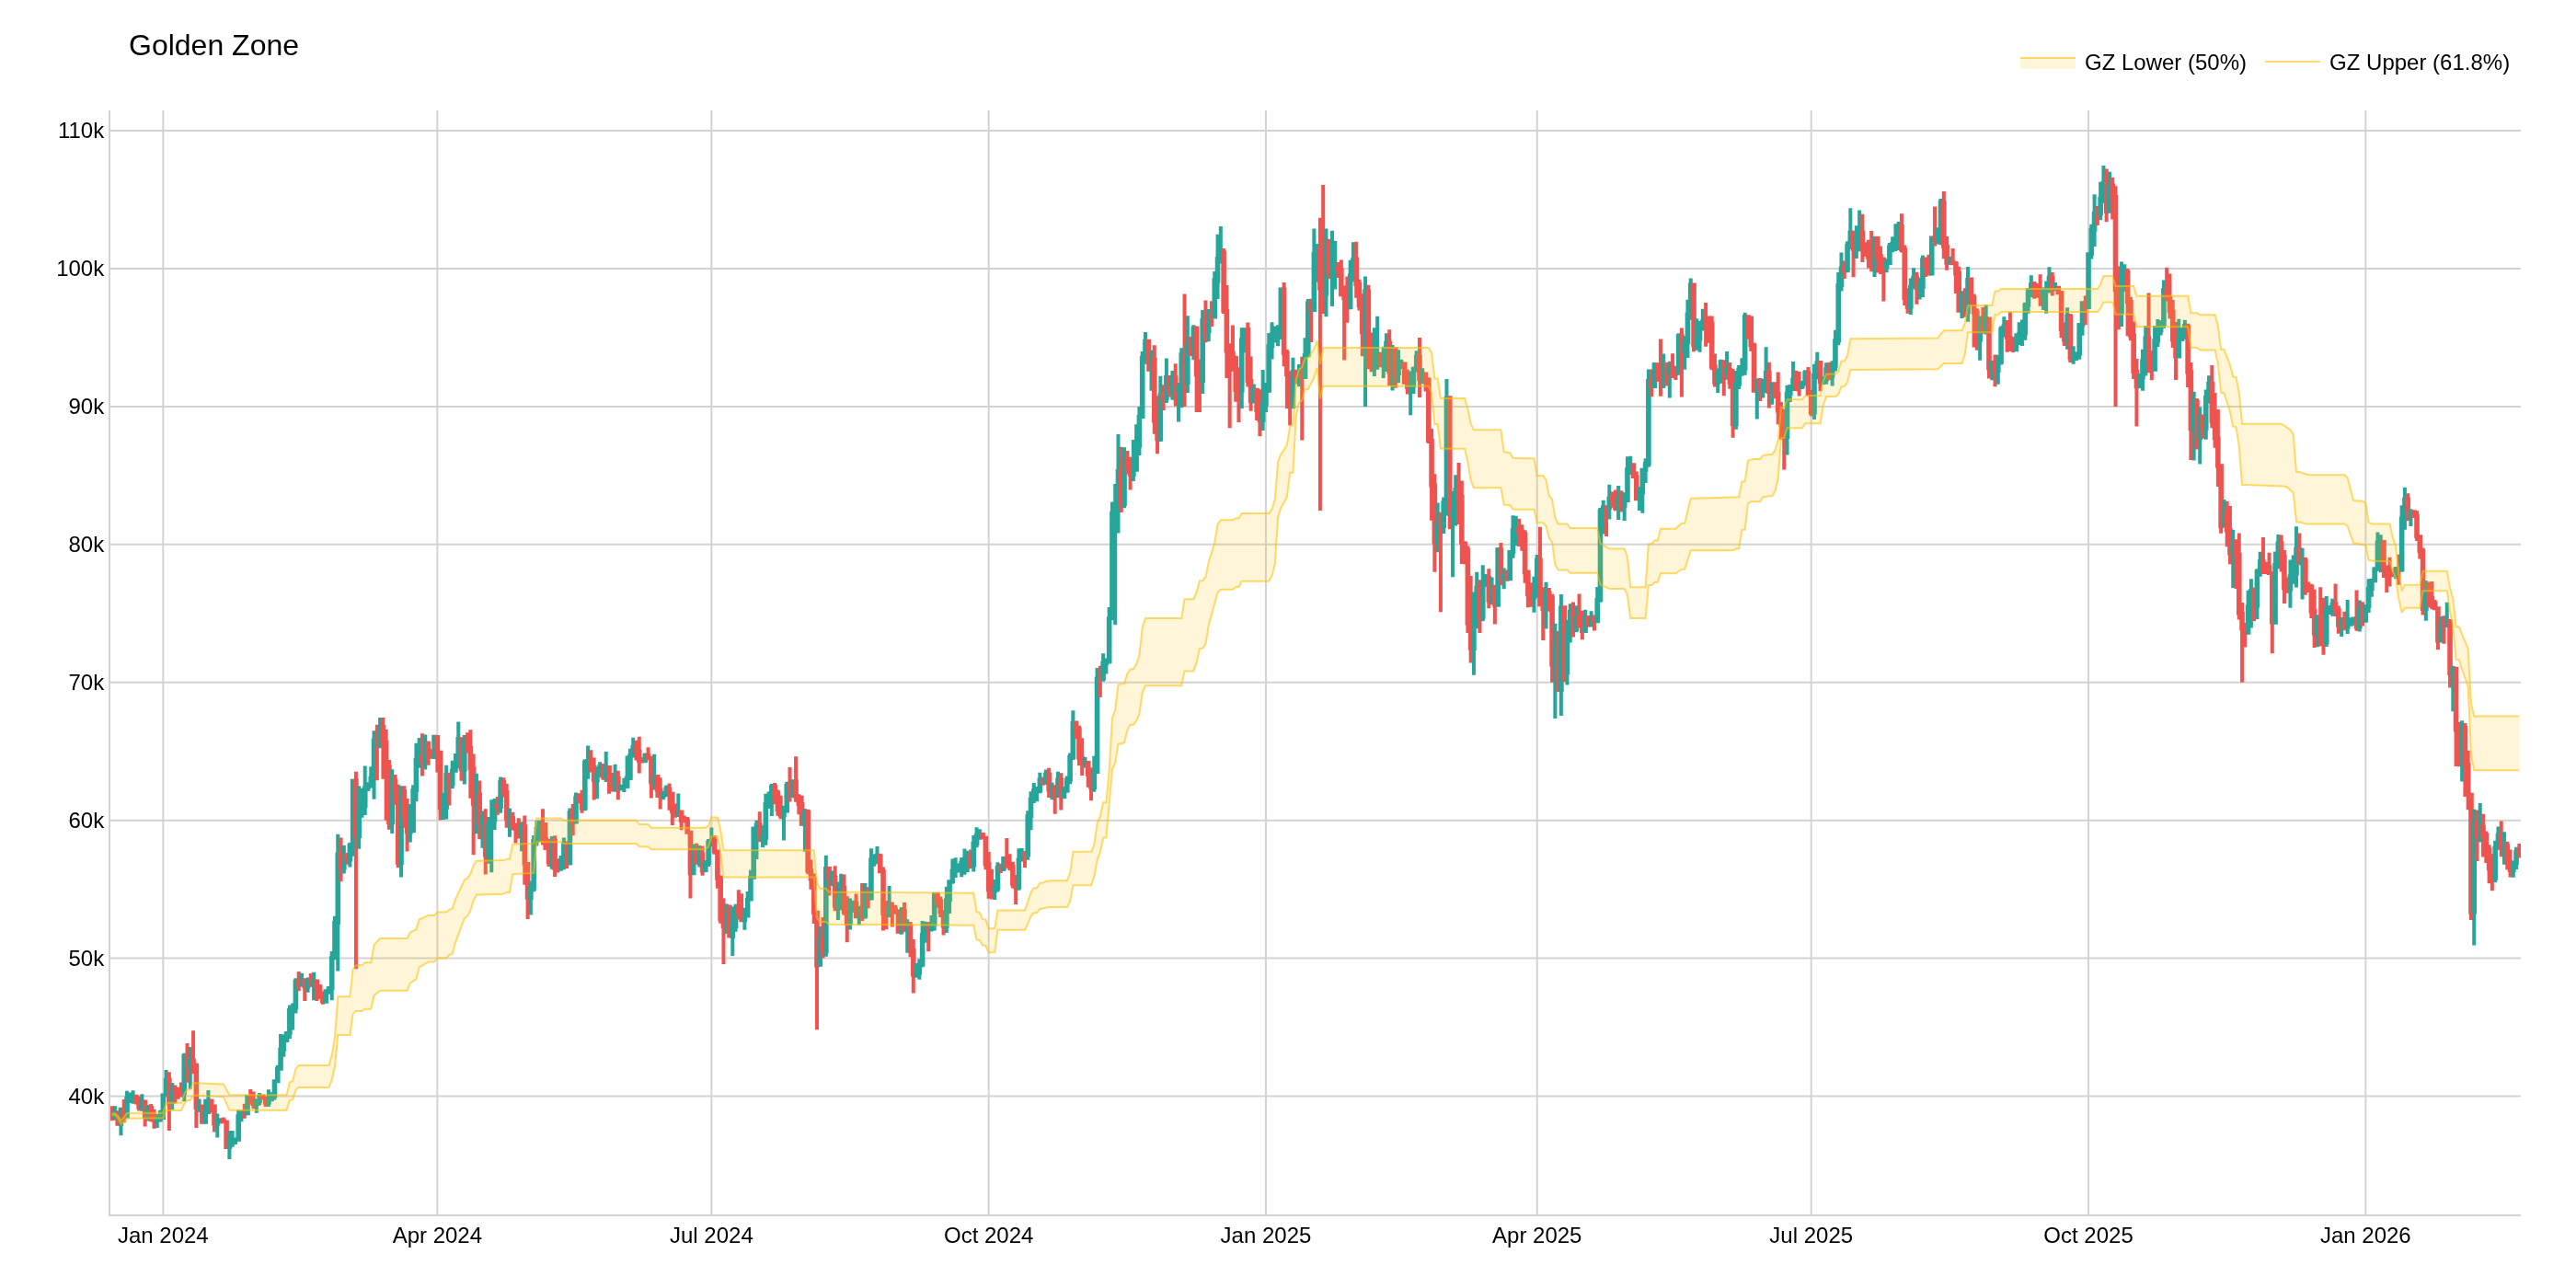
Golden Zone
Minimum bars needed: length bars
(default params: 60 bars (length=60))
The rolling highest-high / lowest-low needs length bars to fill the window. After warmup, zone boundaries update in real-time.
✅ After the warmup window is filled, this indicator produces a new value on every incoming bar in real-time.
The golden zone boundaries trail price because they use a rolling window.
| Event | Lag | Detail |
|---|---|---|
| Zone boundaries shift after new high/low | ≈ length / 2 bars | Rolling highest-high / lowest-low over the specified length |
Formula for custom params: lag ≈ length / 2
The Golden Zone indicator calculates Fibonacci retracement levels based on the highest high and lowest low over a specified rolling period. The "Golden Zone" refers to the area between the 50% and 61.8% Fibonacci retracement levels, which is often considered a key area for potential price reversals or continuations.
This indicator plots dynamic support/resistance levels that update with each bar, making it useful for identifying potential entry and exit points in trending markets.
The calculation formula is:
Highest High (HH) = Rolling maximum of high prices over `length` bars
Lowest Low (LL) = Rolling minimum of low prices over `length` bars
Diff = HH - LL
Upper Level = HH - (Diff × 0.5)      # 50% retracement
Lower Level = HH - (Diff × 0.618)    # 61.8% retracement
def golden_zone(
    data: Union[PdDataFrame, PlDataFrame],
    high_column: str = 'High',
    low_column: str = 'Low',
    length: int = 60,
    retracement_level_1: float = 0.5,
    retracement_level_2: float = 0.618,
    upper_column: str = 'golden_zone_upper',
    lower_column: str = 'golden_zone_lower',
    hh_column: str = 'golden_zone_hh',
    ll_column: str = 'golden_zone_ll'
) -> Union[PdDataFrame, PlDataFrame]:
Example
from investing_algorithm_framework import download

from pyindicators import golden_zone

pl_df = download(
    symbol="btc/eur",
    market="binance",
    time_frame="1d",
    start_date="2023-12-01",
    end_date="2023-12-25",
    save=True,
    storage_path="./data"
)
pd_df = download(
    symbol="btc/eur",
    market="binance",
    time_frame="1d",
    start_date="2023-12-01",
    end_date="2023-12-25",
    pandas=True,
    save=True,
    storage_path="./data"
)

# Calculate Golden Zone for Polars DataFrame
pl_df = golden_zone(pl_df, high_column="High", low_column="Low", length=60)
pl_df.show(10)

# Calculate Golden Zone for Pandas DataFrame
pd_df = golden_zone(pd_df, high_column="High", low_column="Low", length=60)
pd_df.tail(10)