Buyside & Sellside Liquidity
Minimum bars needed: 2 × detection_length + 1 bars
(default params: 15 bars (detection_length=7))
Cluster detection of swing pivots needs detection_length bars on each side. After warmup, new levels appear in real-time.
✅ After the warmup window is filled, this indicator produces a new value on every incoming bar in real-time.
Liquidity levels appear after pivot confirmation, not after smoothing delay.
| Event | Lag | Detail |
|---|---|---|
| Liquidity level appears | ≈ detection_length bars after the pivot | Cluster detection of swing pivots |
| Level is swept (signal fires) | 0 bars | Instant when price crosses the level |
Buyside & Sellside Liquidity is a Smart Money Concept indicator that identifies clustered swing-point liquidity pools, their breaches, and optional liquidity voids.
A buyside liquidity level forms when multiple swing highs (≥ min_cluster_count) cluster within an ATR-scaled margin band. A sellside liquidity level is the mirror image for swing lows. When price breaks through a level, a breach is recorded. Optionally, liquidity voids (large directional candles with minimal overlap) can be detected as areas price is likely to revisit.
def buyside_sellside_liquidity(
    data: Union[PdDataFrame, PlDataFrame],
    detection_length: int = 7,
    margin: float = 6.9,
    buyside_margin: float = 2.3,
    sellside_margin: float = 2.3,
    detect_voids: bool = False,
    atr_period: int = 10,
    atr_void_period: int = 200,
    min_cluster_count: int = 3,
    max_swings: int = 50,
    high_column: str = "High",
    low_column: str = "Low",
    open_column: str = "Open",
    close_column: str = "Close",
) -> Union[PdDataFrame, PlDataFrame]:
Example
import pandas as pd
from pyindicators import (
    buyside_sellside_liquidity,
    buyside_sellside_liquidity_signal,
    get_buyside_sellside_liquidity_stats
)

# Create sample OHLC data
df = pd.DataFrame({
    'Open': [...],
    'High': [...],
    'Low': [...],
    'Close': [...]
})

# Detect buyside and sellside liquidity levels
df = buyside_sellside_liquidity(df, detection_length=7, detect_voids=True)
print(df[['buyside_liq_level', 'sellside_liq_level', 'buyside_liq_broken', 'sellside_liq_broken']])

# Generate trading signals
# 1 = sellside breached (may reverse up), -1 = buyside breached (may reverse down)
df = buyside_sellside_liquidity_signal(df)
breach_events = df[df['bsl_signal'] != 0]

# Get statistics
stats = get_buyside_sellside_liquidity_stats(df)
print(f"Buyside levels: {stats['total_buyside_levels']}")
print(f"Sellside levels: {stats['total_sellside_levels']}")
print(f"Total breaches: {stats['total_breaches']}")
The function returns:
buyside_liq_level/sellside_liq_level: Price of the liquidity levelbuyside_liq_top/buyside_liq_bottom: Upper and lower bounds of the buyside zonesellside_liq_top/sellside_liq_bottom: Upper and lower bounds of the sellside zonebuyside_liq_broken/sellside_liq_broken: 1 when the level is breachedliq_void_bullish/liq_void_bearish: 1 when a liquidity void is detected (ifdetect_voids=True)liq_void_top/liq_void_bottom: Bounds of the void zone
Trading Strategy:
- Buyside levels act as resistance; a breach signals institutional selling (potential reversal down)
- Sellside levels act as support; a breach signals institutional buying (potential reversal up)
- Liquidity voids are imbalance zones that price often revisits—use as take-profit targets
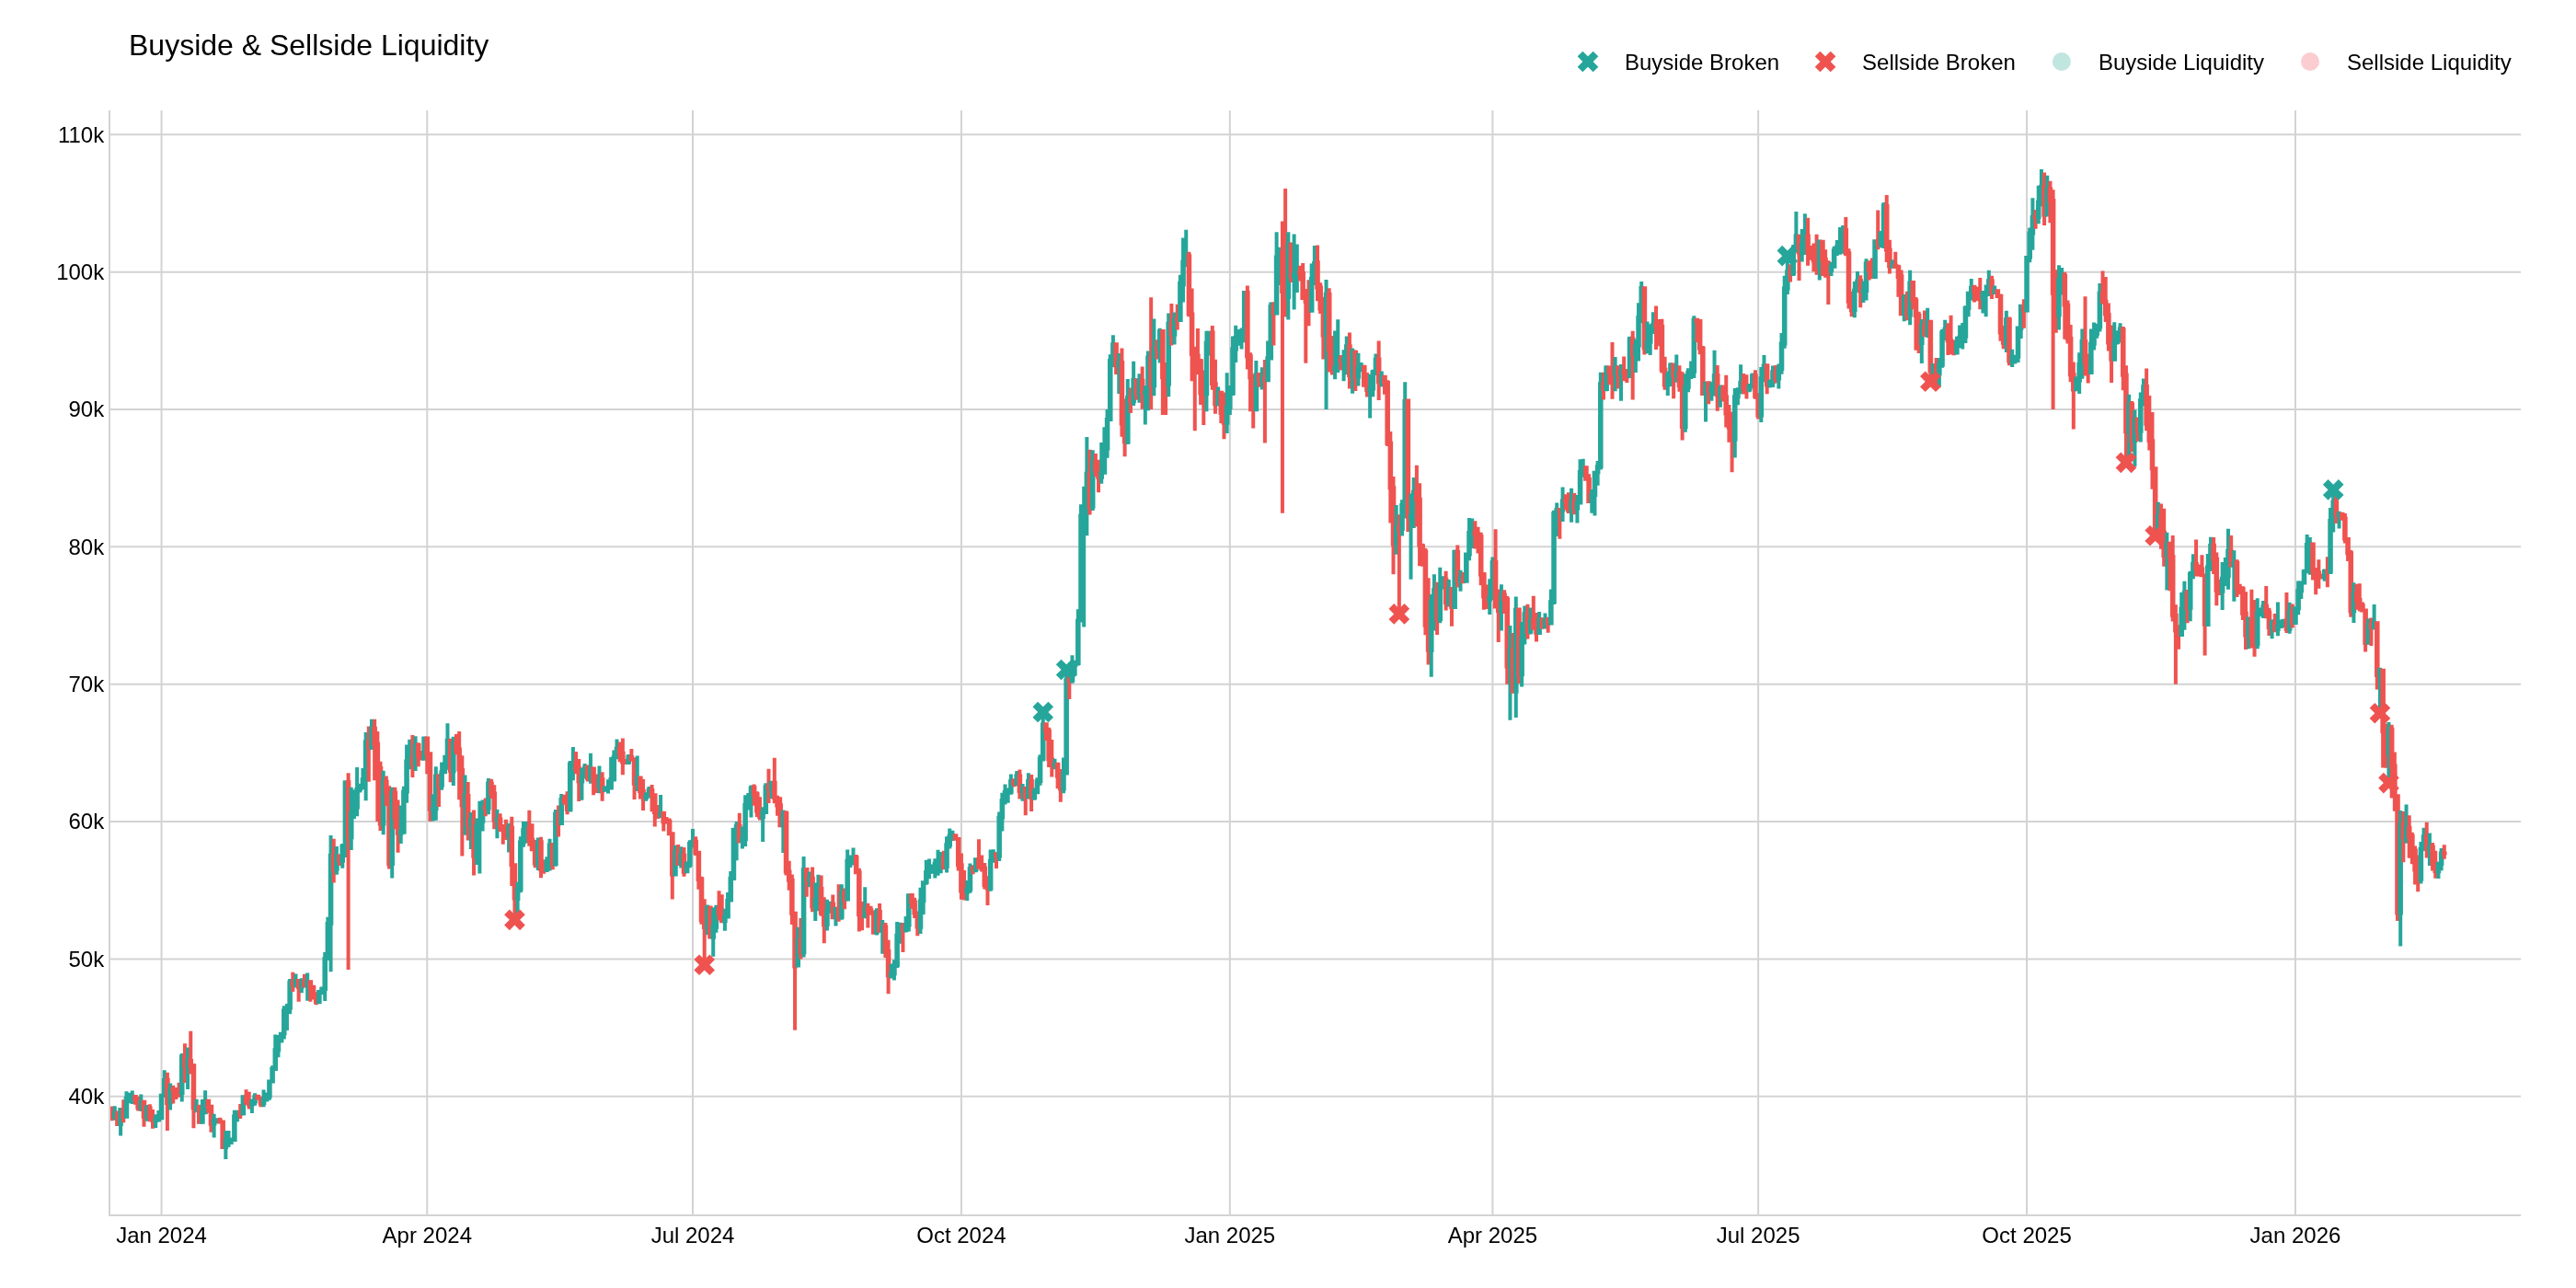
The image above uses the following parameters:
| Parameter | Value |
|---|---|
detection_length | 7 |