Liquidity Levels / Voids (VP)
Minimum bars needed: detection_length bars
(default params: Depends on detection_length)
Volume profile is computed between confirmed swing points. After the first pair of swings, zones appear in real-time.
✅ After the warmup window is filled, this indicator produces a new value on every incoming bar in real-time.
Levels and voids appear after swing confirmation.
| Event | Lag | Detail |
|---|---|---|
| Level / void zone appears | ≈ detection_length bars | Volume profile computed between confirmed swing points |
| Price enters a void (signal) | 0 bars | Instant once the zone exists |
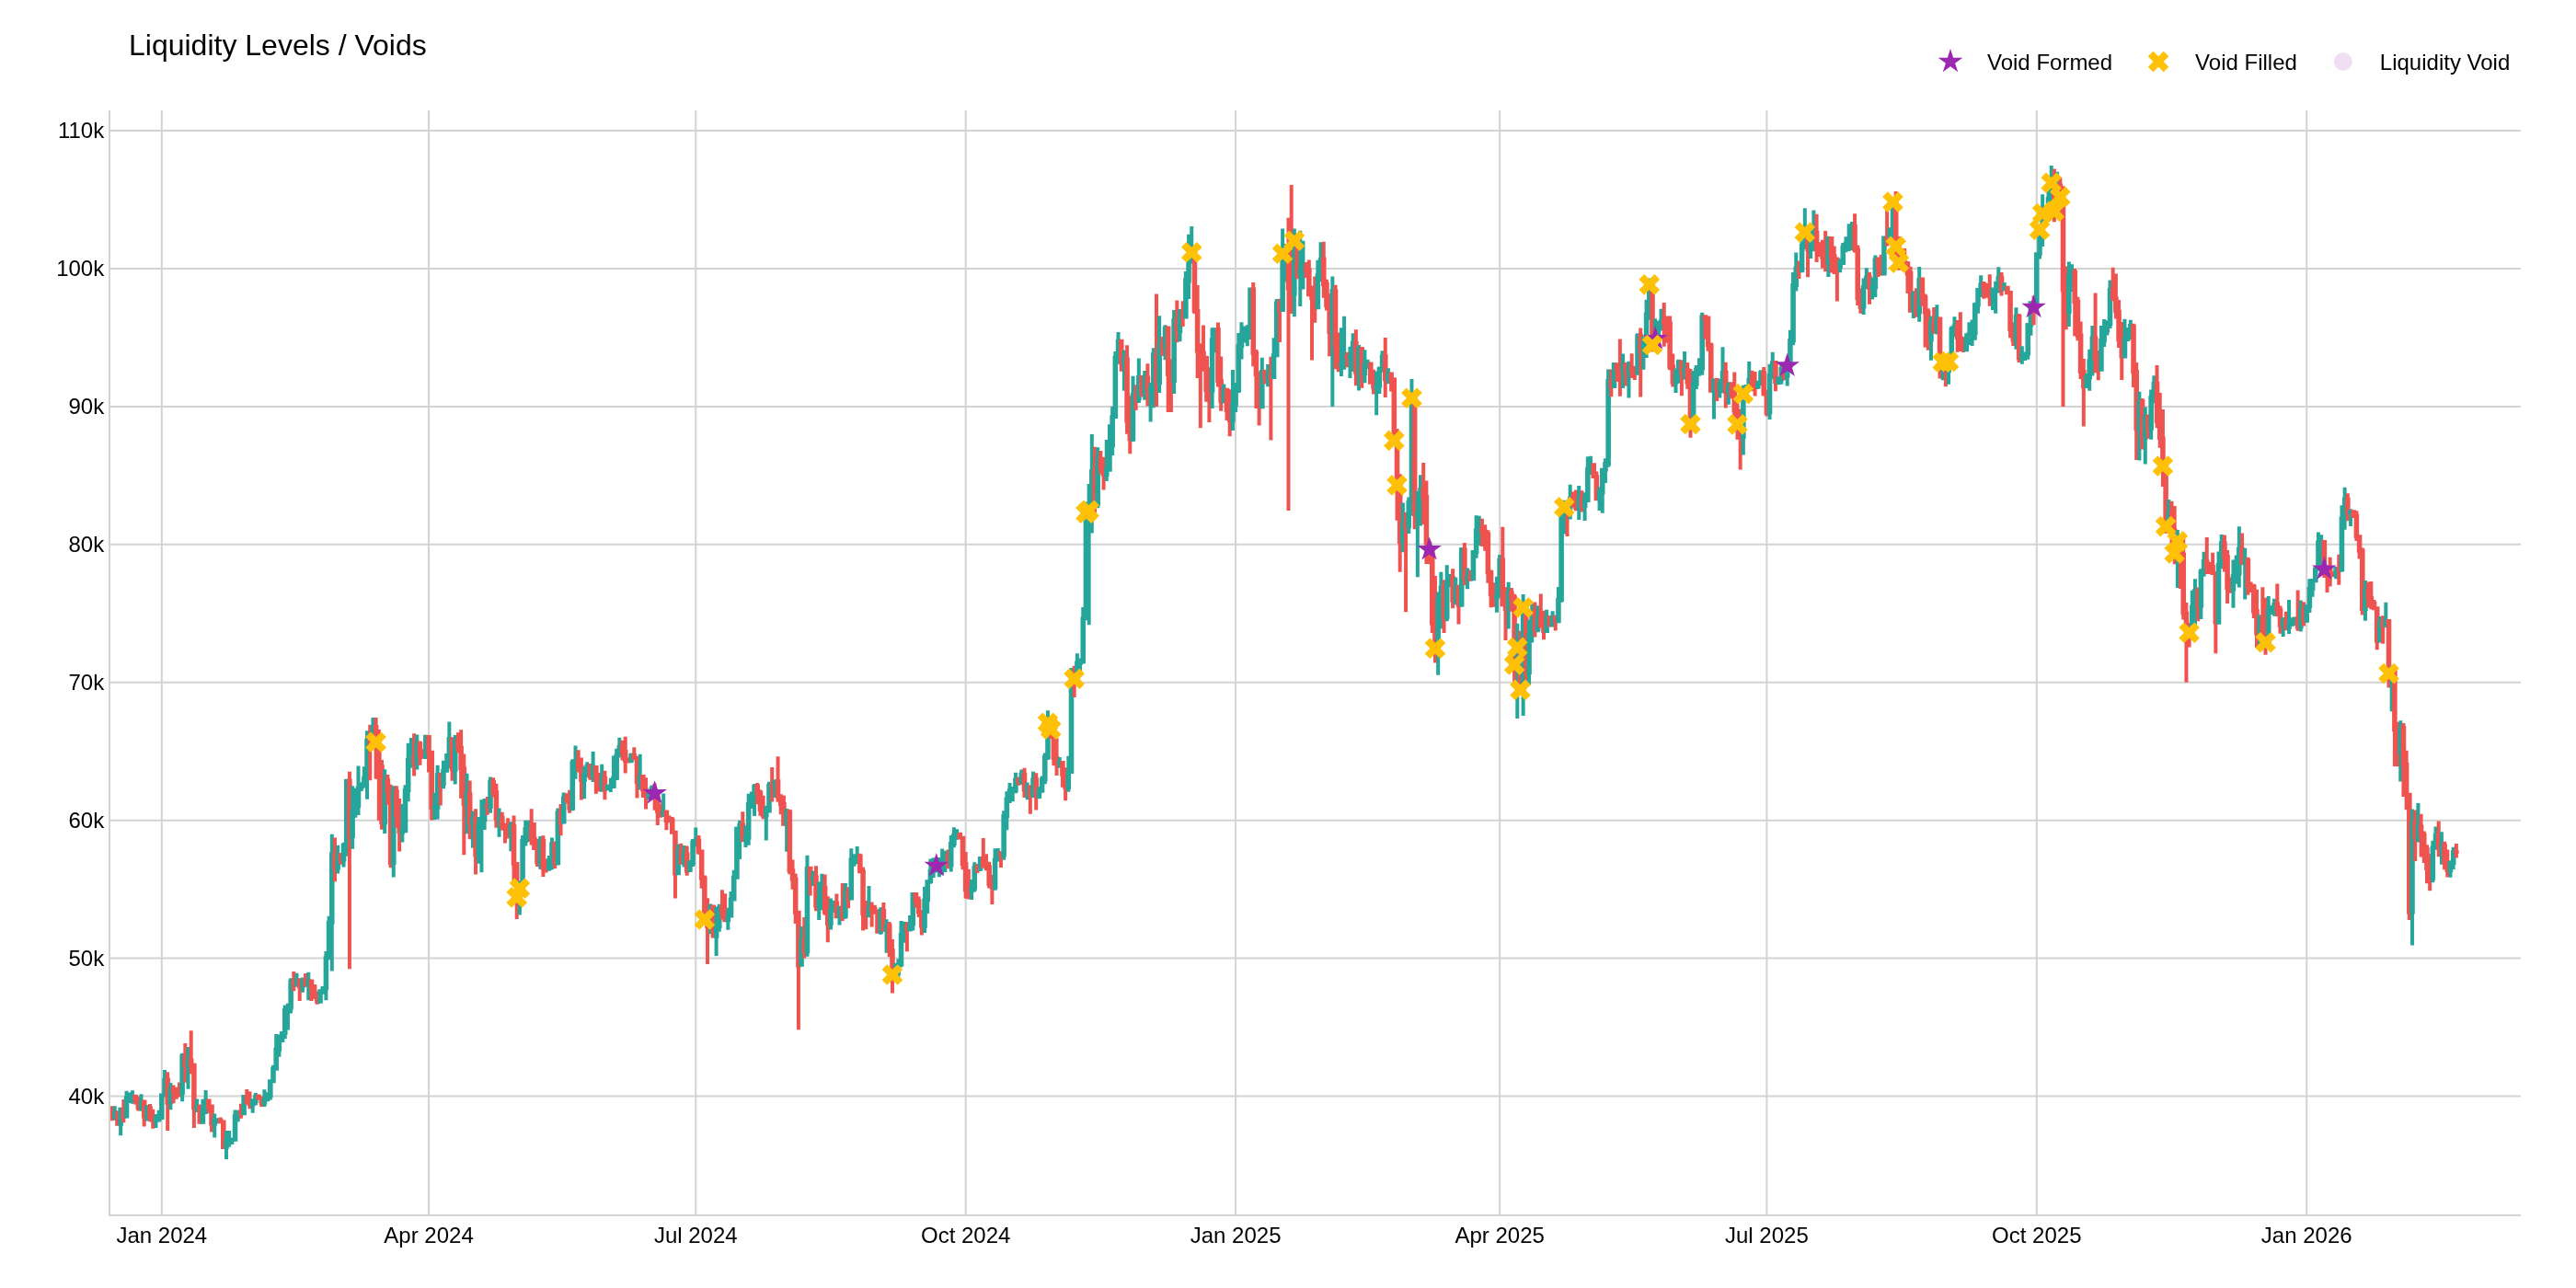
Liquidity Levels / Voids is a Smart Money Concept indicator that uses volume-profile analysis between swing points to identify price levels where little volume was traded — these are liquidity voids that price tends to revisit.
Between each pair of detected swing points, the price range is divided into equally-spaced levels and a volume profile is built. Levels where the traded volume is below a configurable threshold (as a fraction of the maximum level's volume) are classified as liquidity voids — low-volume zones that act as price magnets.
Key parameters:
- Detection Length — lookback/look-ahead period for swing detection (default: 47).
- Threshold — volume fraction below which a level is a void (default: 0.21, i.e. 21%).
- Sensitivity — number of price levels per swing range (default: 27). Higher = thinner, more granular zones.
def liquidity_levels_voids(
    data: Union[PdDataFrame, PlDataFrame],
    detection_length: int = 47,
    threshold: float = 0.21,
    sensitivity: int = 27,
    high_column: str = "High",
    low_column: str = "Low",
    close_column: str = "Close",
    volume_column: Optional[str] = "Volume",
    void_formed_column: str = "liq_void_formed",
    void_filled_column: str = "liq_void_filled",
    void_count_column: str = "liq_void_count",
    void_nearest_top_column: str = "liq_void_nearest_top",
    void_nearest_bottom_column: str = "liq_void_nearest_bot",
    void_above_count_column: str = "liq_void_above_count",
    void_below_count_column: str = "liq_void_below_count",
) -> Union[PdDataFrame, PlDataFrame]:
Example
import pandas as pd
from pyindicators import (
    liquidity_levels_voids,
    liquidity_levels_voids_signal,
    get_liquidity_levels_voids_stats
)

# Create sample OHLCV data
df = pd.DataFrame({
    'High': [...],
    'Low': [...],
    'Close': [...],
    'Volume': [...]
})

# Detect liquidity voids (volume-profile based)
df = liquidity_levels_voids(df, detection_length=47, threshold=0.21, sensitivity=27)
print(df[['liq_void_count', 'liq_void_nearest_top', 'liq_void_nearest_bot']])

# Generate directional signal based on void proximity
# 1 = price below nearest void (bullish magnet), -1 = price above (bearish magnet)
df = liquidity_levels_voids_signal(df)
signals = df[df['liq_void_signal'] != 0]

# Get statistics
stats = get_liquidity_levels_voids_stats(df)
print(f"Formation events: {stats['total_formation_events']}")
print(f"Fill events: {stats['total_fill_events']}")
print(f"Active voids: {stats['active_voids_last_bar']}")
The function returns:
liq_void_formed: 1 on bars where new liquidity voids are identifiedliq_void_filled: 1 on bars where a void is filled (price crosses through it)liq_void_count: Total number of active unfilled voidsliq_void_nearest_top/liq_void_nearest_bot: Boundaries of the nearest unfilled void to the current closeliq_void_above_count/liq_void_below_count: Unfilled voids above/below the current price
Trading Strategy:
- Liquidity voids act as magnets — price is drawn to fill low-volume areas
- When price is below a void, expect it to be pulled up (bullish bias)
- When price is above a void, expect it to be pulled down (bearish bias)
- Use
liq_void_countto gauge overall market imbalance - Decrease
detection_lengthfor more frequent void detection on shorter timeframes