Premium / Discount Zones
Warmup Window
Minimum bars needed: 2 × swing_length + 1 bars
(default params: 21 bars (swing_length=10))
Swing high/low confirmation needs swing_length bars on each side. After warmup, zone boundaries update in real-time.
✅ After the warmup window is filled, this indicator produces a new value on every incoming bar in real-time.
Real-time Indicator
Zones update after swing confirmation, not after smoothing delay.
| Event | Lag | Detail |
|---|---|---|
| Zone boundaries update | ≈ swing_length bars after the swing | Zones computed from most recent confirmed swing high/low |
| Price enters premium / discount zone | 0 bars | Instant comparison of close vs zone levels |
Identifies Premium, Discount, and Equilibrium zones based on the current market range defined by swing highs and swing lows. Inspired by Smart Money Concepts (SMC) trading, the market is divided into zones relative to the most recent significant swing range:
- Premium Zone -- the upper half of the range (above equilibrium). Price is considered expensive; smart money is more likely to sell.
- Discount Zone -- the lower half of the range (below equilibrium). Price is considered cheap; smart money is more likely to buy.
- Equilibrium -- the exact midpoint (50%) of the range, acting as the decision boundary.
def premium_discount_zones(
    data: Union[PdDataFrame, PlDataFrame],
    swing_length: int = 10,
    high_column: str = "High",
    low_column: str = "Low",
    close_column: str = "Close",
) -> Union[PdDataFrame, PlDataFrame]:
Returns the following columns:
pdz_range_high: Current swing range highpdz_range_low: Current swing range lowpdz_equilibrium: Midpoint of the rangepdz_zone:"premium","discount", or"equilibrium"pdz_zone_pct: How deep into the zone (0-100%)
Signal function:
pdz_signal:1= discount zone (potential buy),-1= premium zone (potential sell),0= equilibrium / no range
Example
from investing_algorithm_framework import download

from pyindicators import (
    premium_discount_zones,
    premium_discount_zones_signal,
    get_premium_discount_zones_stats,
)

pd_df = download(
    symbol="btc/eur",
    market="bitvavo",
    time_frame="1d",
    start_date="2024-01-01",
    end_date="2024-06-01",
    pandas=True,
)

# Calculate Premium / Discount Zones
pd_df = premium_discount_zones(pd_df, swing_length=10)
pd_df = premium_discount_zones_signal(pd_df)

# Get summary statistics
stats = get_premium_discount_zones_stats(pd_df)
print(stats)

pd_df[["Close", "pdz_range_high", "pdz_range_low", "pdz_equilibrium", "pdz_zone", "pdz_zone_pct", "pdz_signal"]].tail(10)
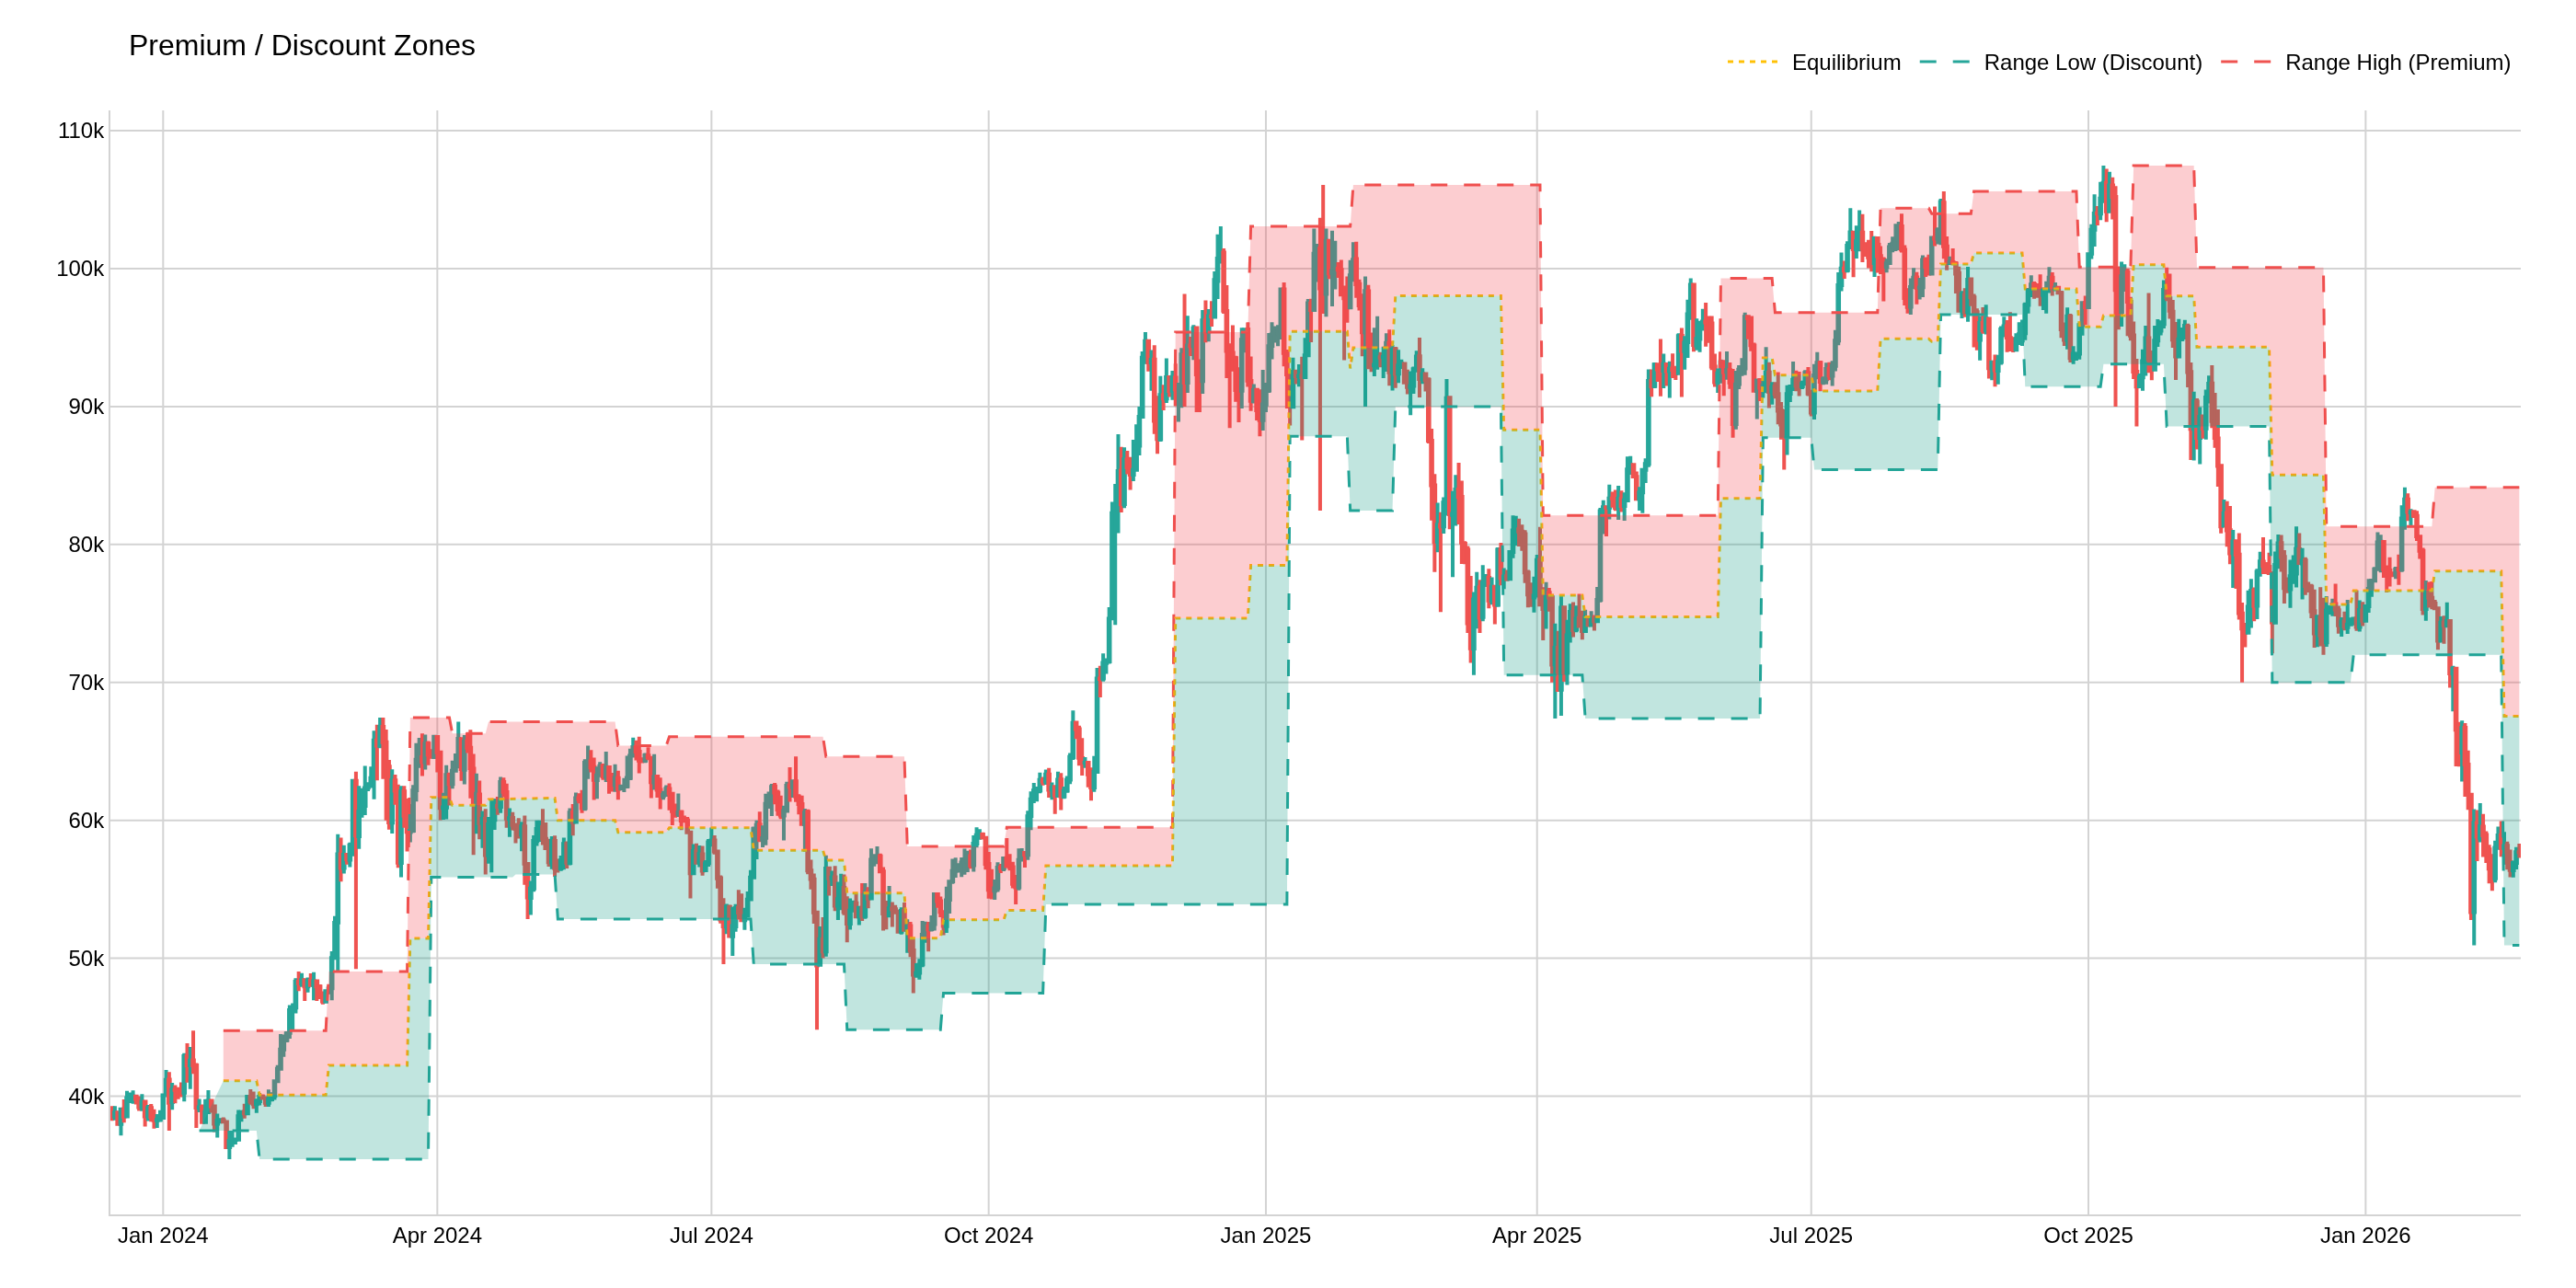
Chart Parameters
The image above uses the following parameters:
| Parameter | Value |
|---|---|
swing_length | 10 |